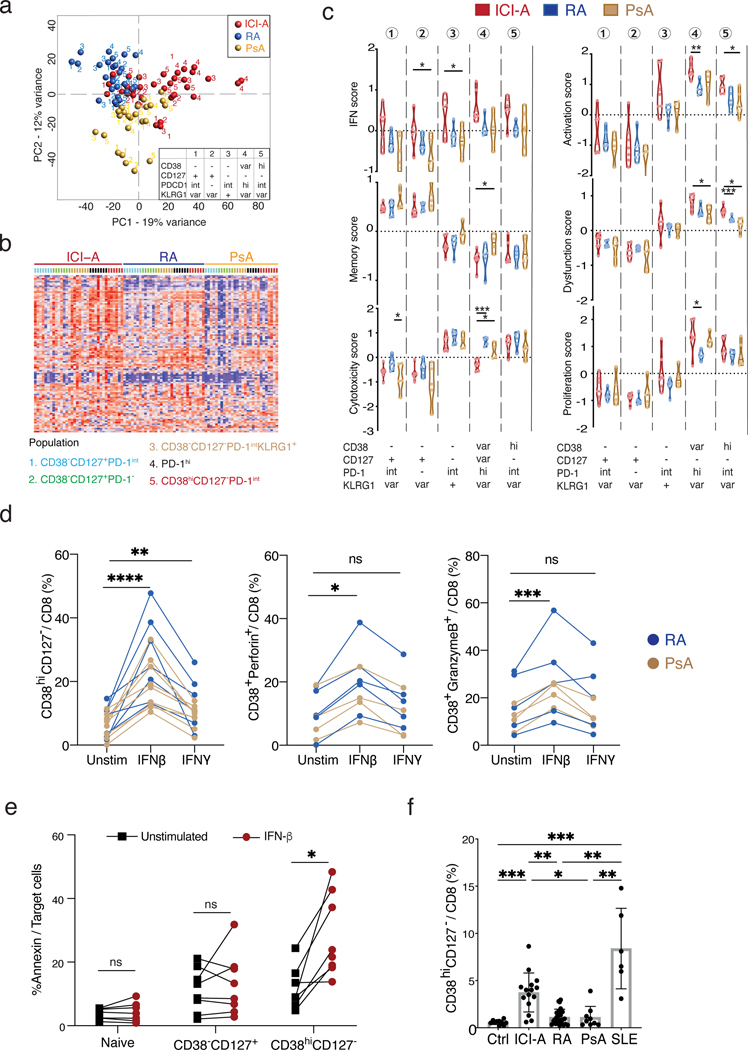
Figure 4. Type I IFN drives the expansion of synovial CD8 T cells in ICI-arthritis.
a) PCA plot showing the expression of 106 IFN-inducible genes across the sorted populations ordered by diseases. b) Heatmap showing clusters of CD8 T cell populations using genes differentially expressed by ICI-A, RA and PsA, with numbers indicating five sorted populations colored by disease. c) Gene module scores of the CD8 T cell populations as in (b) from ICI-A, PsA and RA synovial fluid, calculated based on differentially expressed genes (int = intermediate, var = variable). d) Frequency of CD38hiCD127− cells, CD38hiperforin+ cells and CD38+granzyme B+ cells in CD8 T cells from RA or PsA SFMC cultured with IFN-β or IFN-γ for indicated times. Lines link the same patient sample under the different conditions. Data represents ≥5 individual experiments. e) Cytotoxicity assay of sorted naïve, CD38−CD127+, or CD38hiCD127− CD8 T cells from healthy blood. Data represents 2 individual experiments. f) Frequency of CD38hiCD127− cells among CD8 T cells from PBMC from control (n=10), ICI-A (n=15), RA (n=22), PsA (n=9), and SLE (n=6) patients. Mean ± SD shown. *p<0.05, **p<0.001, ***p<0.0001 by Kruskal-Wallis test in (c) and (f), Wilcoxon matched-pair test in (d) paired T test in (e).

