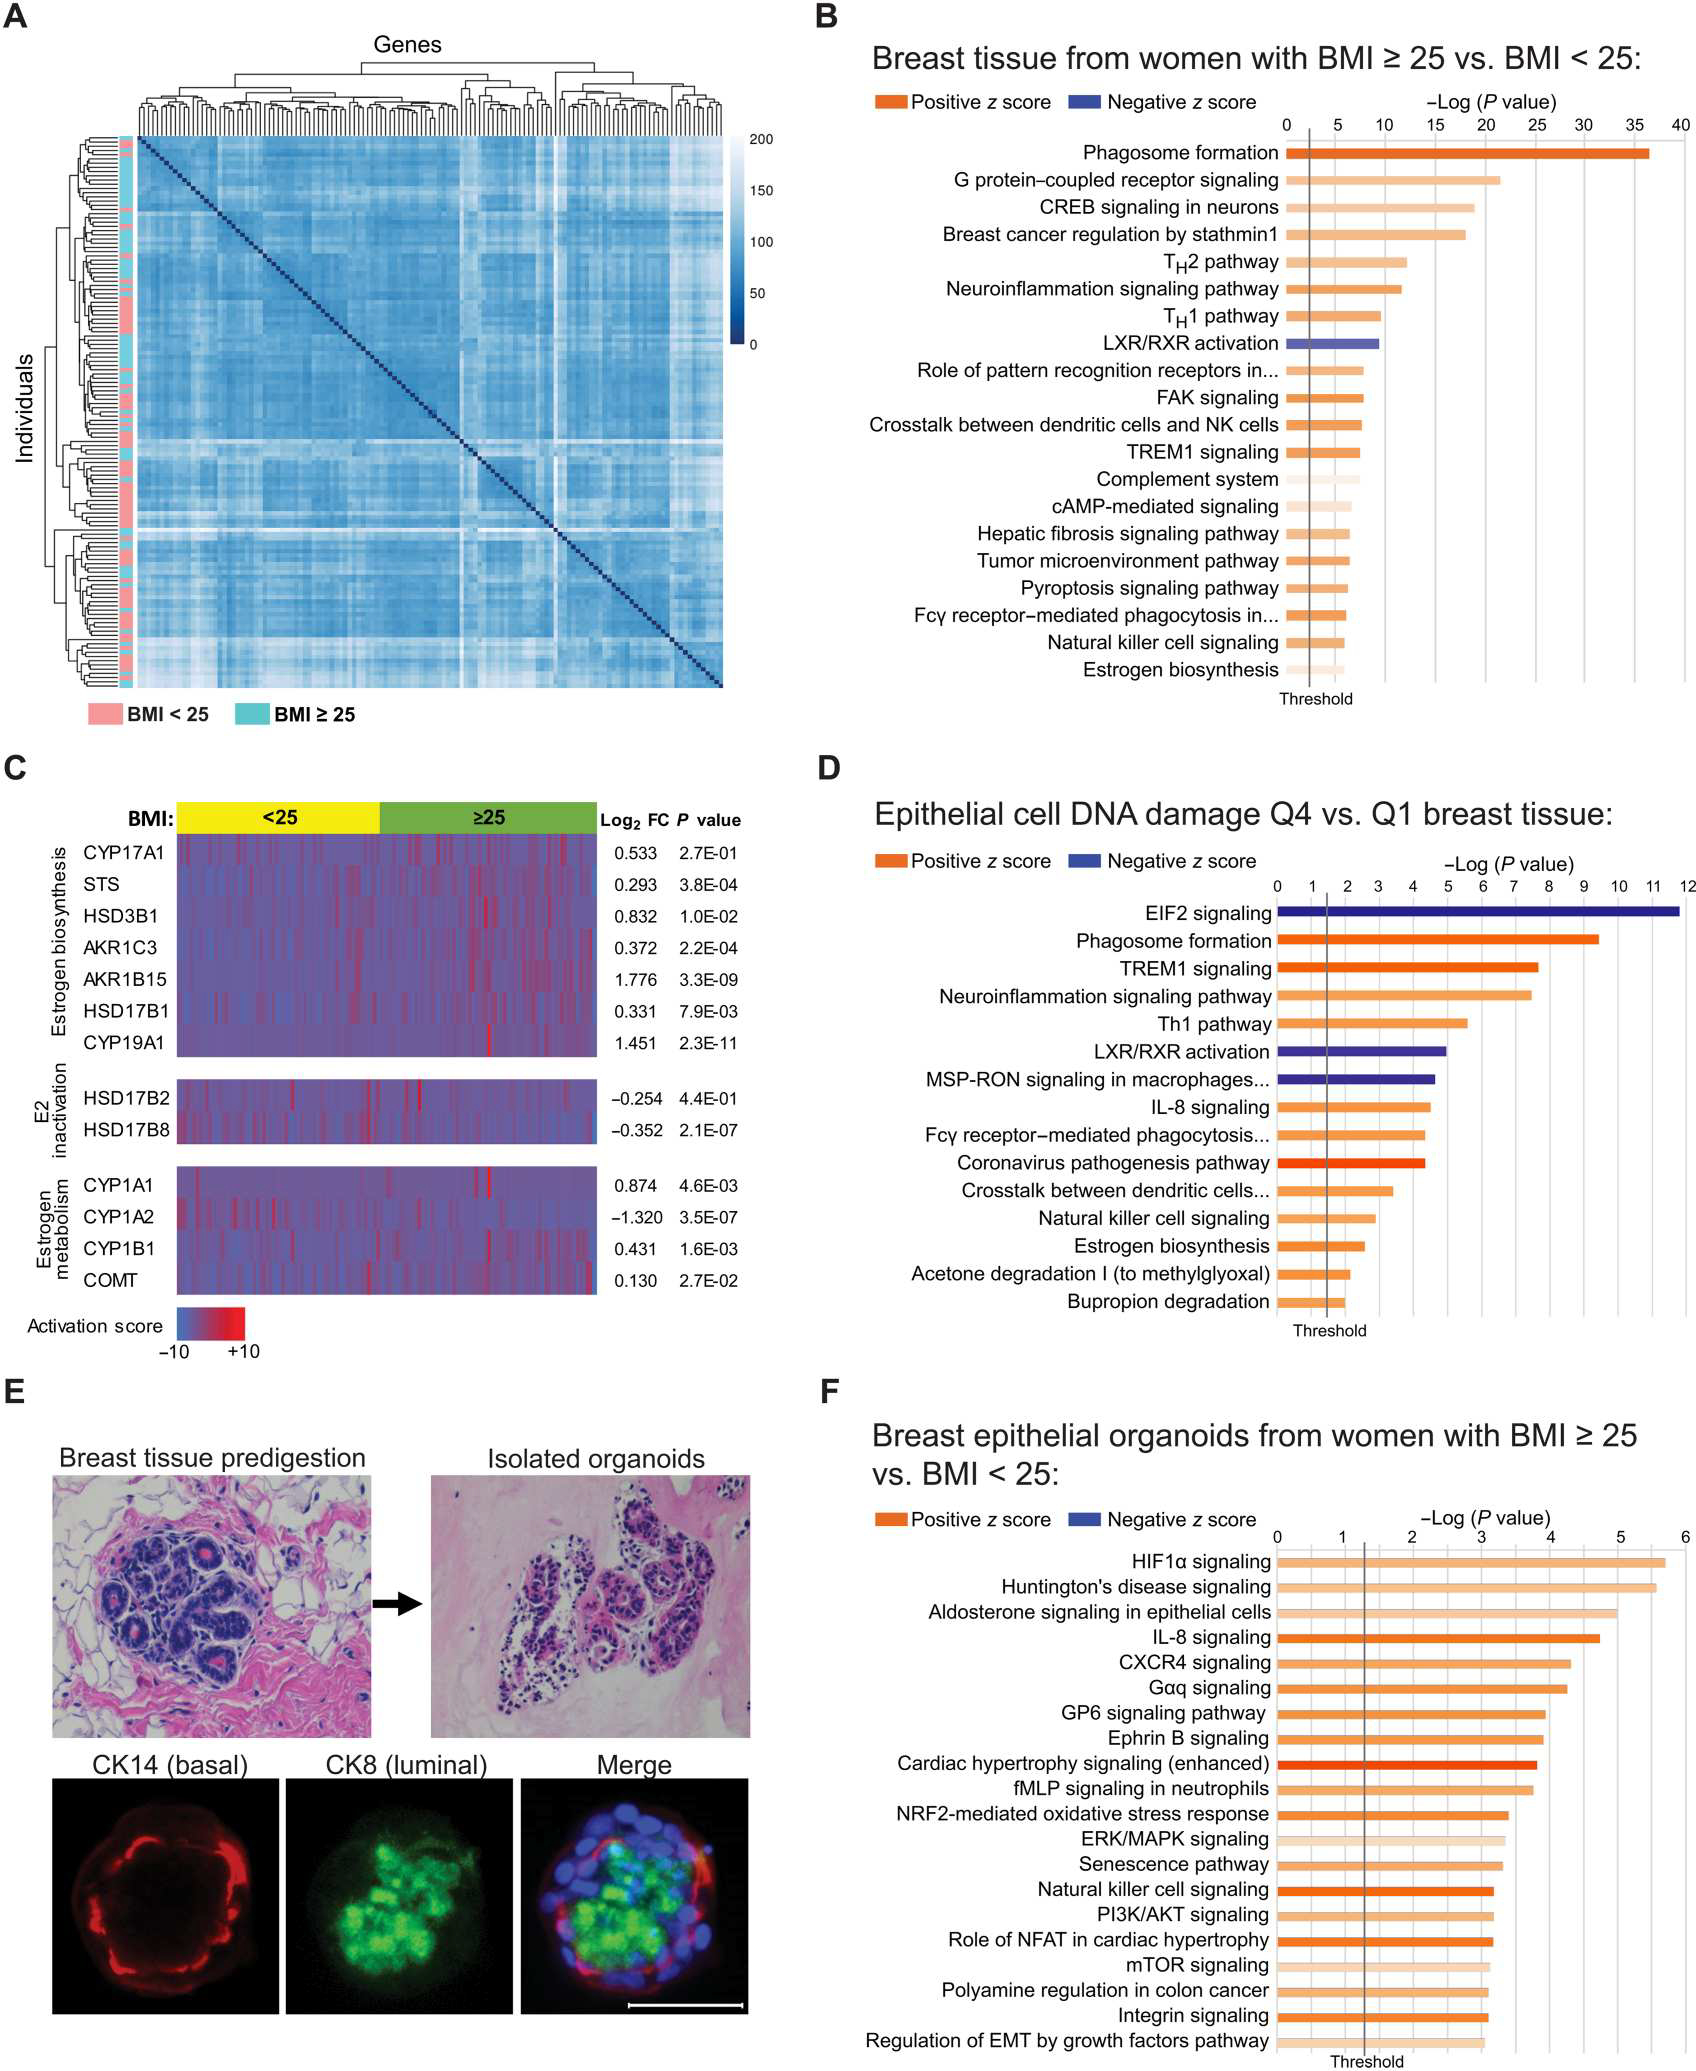
Fig. 2. Elevated BMI is associated with significant changes in gene expression in breast adipose tissue and in breast epithelial cells of BRCA mutation carriers.

(A) Unsupervised heatmap of whole breast tissue gene expression by RNA-seq in BRCA mutation carriers identified by BMI category of <25 (n = 64, blue) or ≥25 (n = 67, pink). Rows represent individual patients, and columns represent genes. (B) IPA analysis of RNA-seq data showing activation (z score) of the top 20 canonical pathways regulated in breast tissue from BRCA mutation carriers with BMI ≥ 25 compared with carriers with BMI < 25 with an absolute value z score of >0.5. (C) Heatmap of RNA-seq gene expression data generated from breast tissue of BRCA mutation carriers grouped by BMI category of <25 (yellow) or ≥25 (green) showing selected genes associated with estrogen biosynthesis, estradiol (E2) inactivation, and estrogen metabolism. Corresponding gene expression (log2FC) and P values are shown in tissue from women with BMI ≥ 25 relative to BMI < 25. Columns represent individual patients. (D) DNA damage in breast epithelial cells was quantified in tissue sections from n = 61 patients from whom corresponding whole breast tissue RNA-seq data were also available. The cases were stratified by quartile of DNA damage, and the breast tissue gene expression from cases with the highest amount of DNA damage [quartile 4 (Q4)] was compared with that from cases with the lowest amount [quartile 1 (Q1)] of DNA damage. Top 15 canonical pathways regulated in Q4 versus Q1 with an absolute value z score of >2.0 are shown. (E) Representative H&E-stained images of a breast tissue section before digestion and epithelial organoids after isolation. Organoids stained positively for luminal marker cytokeratin 8 (CK8; green) and basal marker cytokeratin 14 (CK14; red) as shown by IF staining merged with Hoechst (blue). Scale bar, 50 μm. (F) IPA analysis of RNA-seq gene expression data showing activation of the top 20 canonical pathways regulated in primary breast epithelial organoids from BRCA mutation carriers with BMI ≥ 25 (n = 9) relative to carriers with BMI < 25 (n = 10) with an absolute value z score of >1.0. The lengths of the bars on all canonical pathway graphs are determined by the Fisher’s exact test. P value with entities that have a −log (P value) > 1.3 is shown.
