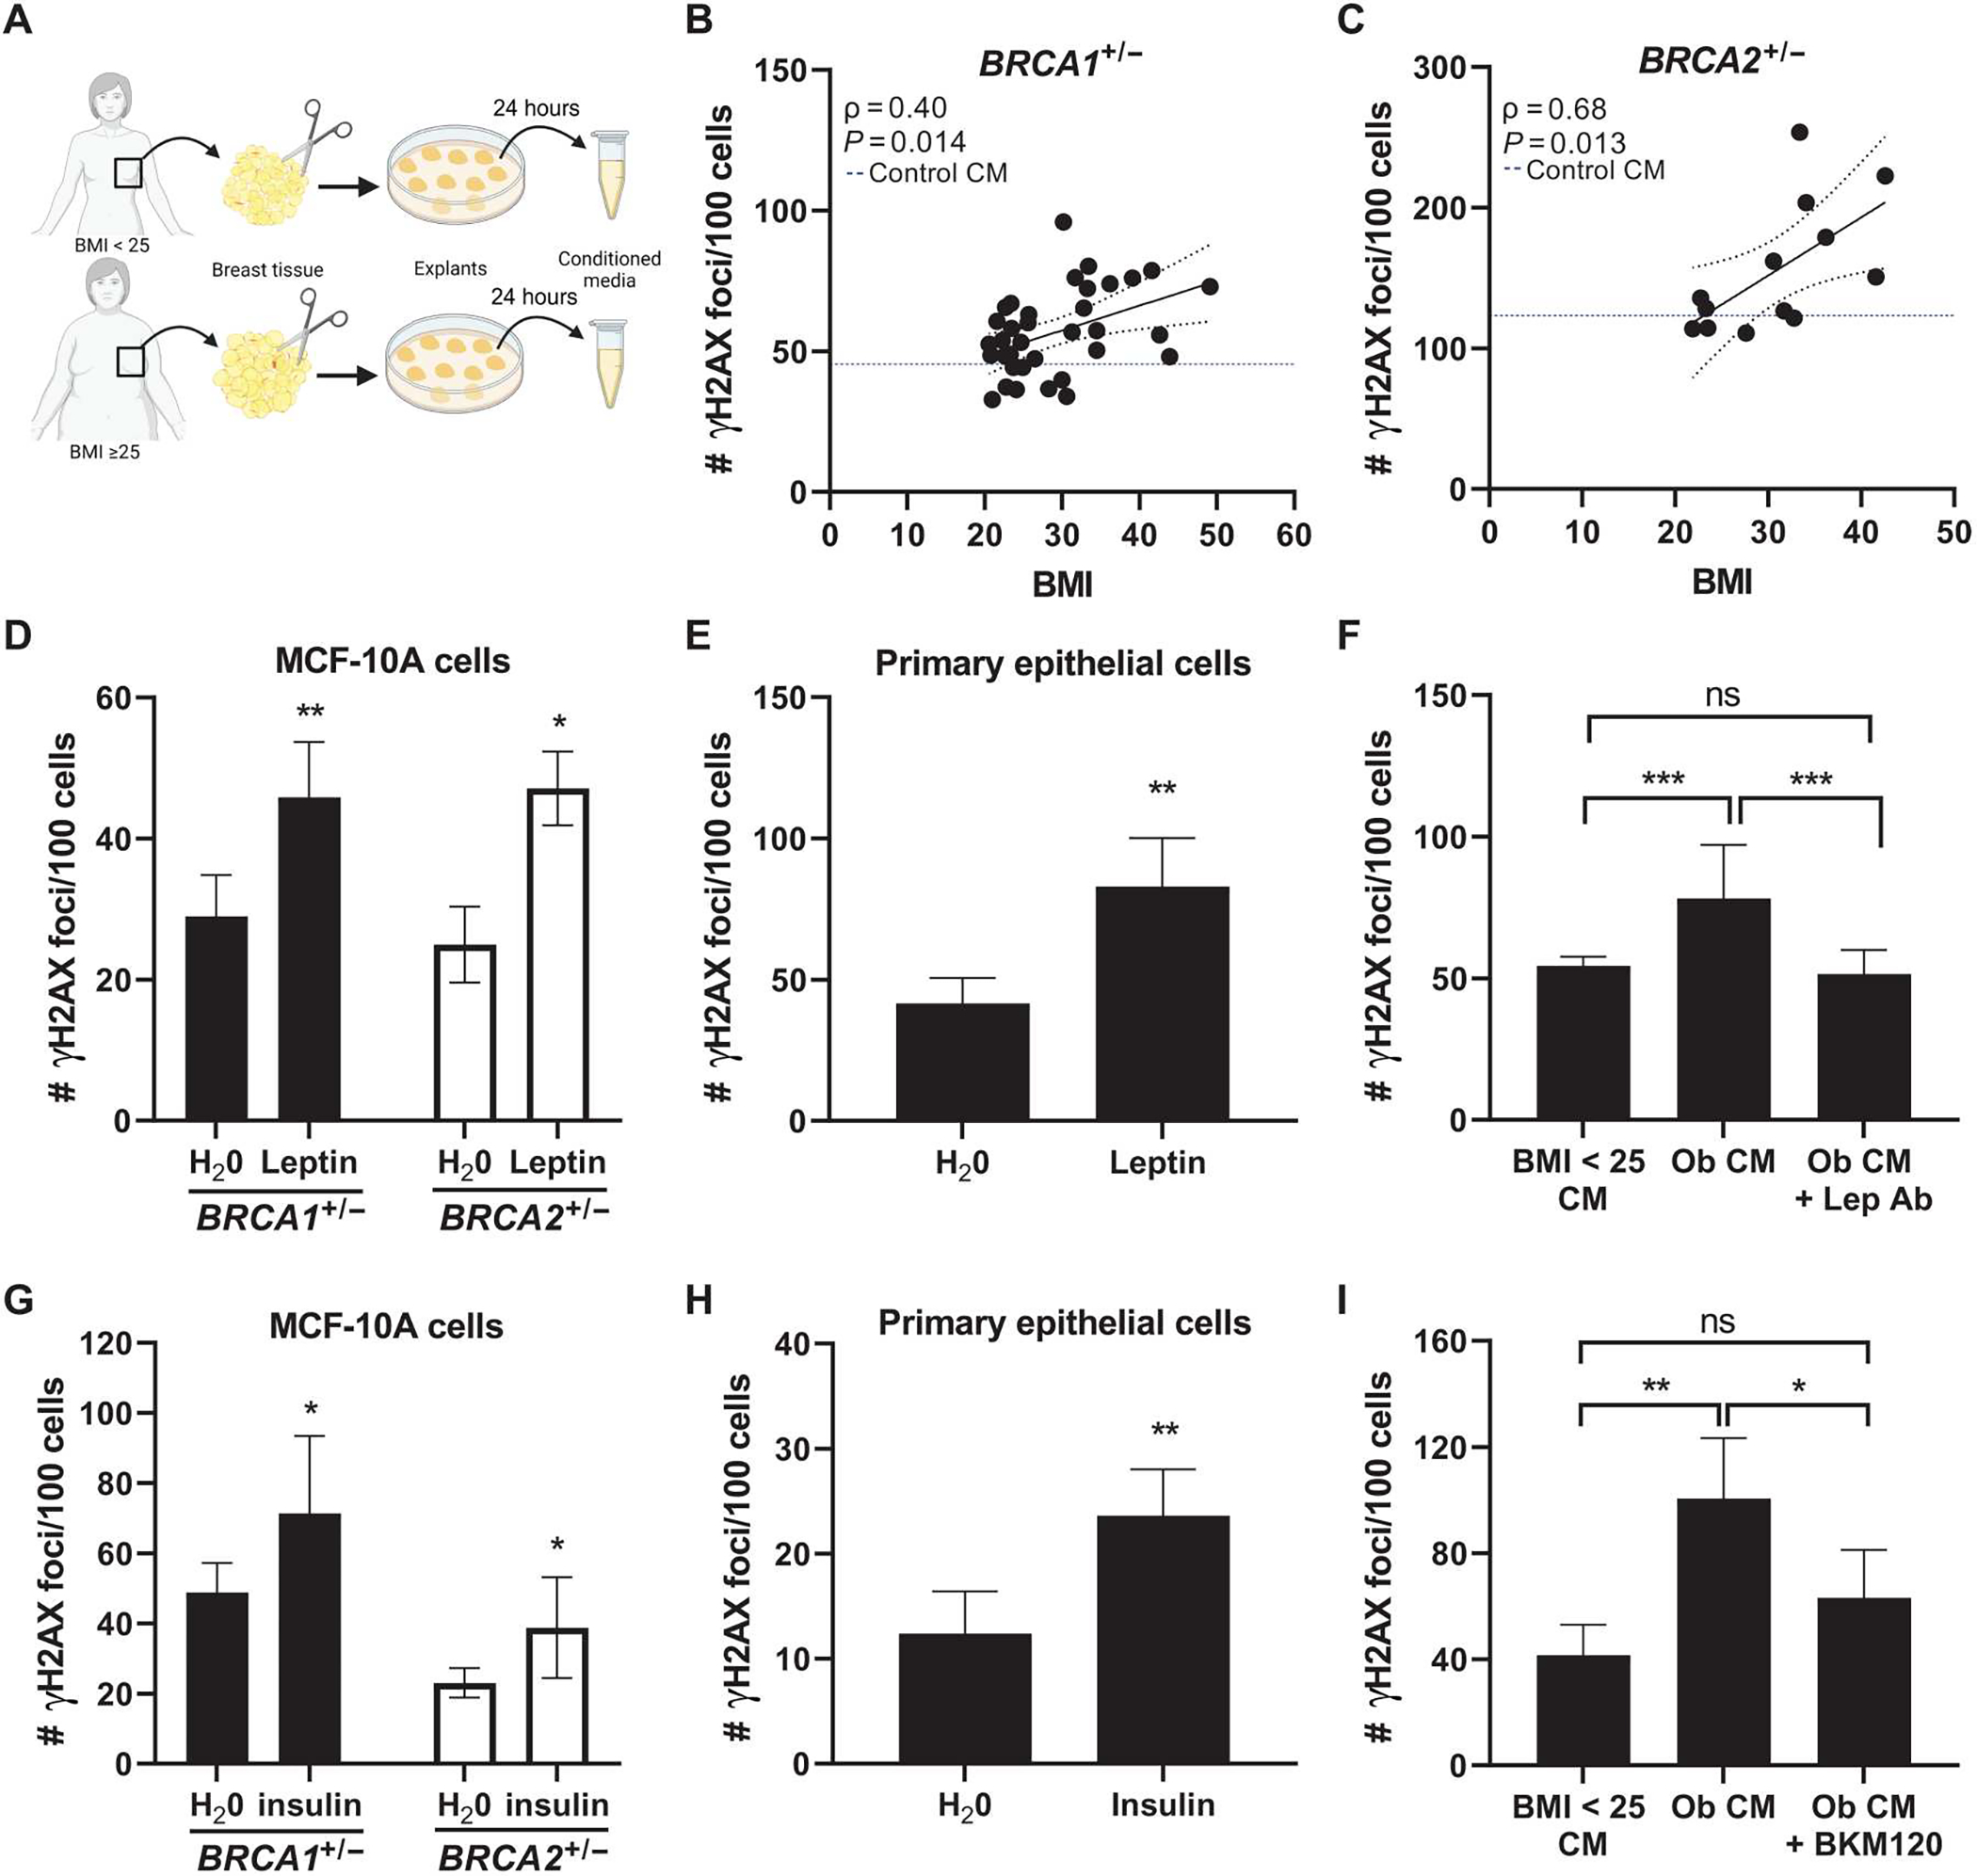
Fig. 4. Obesity-induced changes to the local breast adipose microenvironment promote DNA damage in BRCA1 and BRCA2 heterozygous breast epithelial cells.

(A) Experimental schematic showing the collection of breast adipose tissue conditioned medium (CM) from women with BMI < 25 and with BMI ≥ 25. (B) MCF-10A cells were treated with CM for 24 hours. DNA damage assessed by IF (number of γH2AX foci/100 cells) is shown correlated with BMI in BRCA1+/− (n = 36 CM cases) and (C) BRCA2+/− (n = 13 CM cases) MCF-10A cells. Blue dotted line represents amount of DNA damage induced by control CM (medium not conditioned by adipose explants). Spearman’s rank correlation coefficient (ρ) and associated P value are shown along with 95% confidence intervals. (D) DNA damage in BRCA1+/− and BRCA2+/− MCF-10A cells and in (E) primary BRCA1+/− breast epithelial cells treated with leptin (400 ng/μl) for 24 hours. (F) DNA damage in BRCA1+/− MCF-10A cells after 24-hour treatment with CM derived from a woman with BMI < 25 (“BMI < 25 CM”), with obesity (“Ob CM”), or with Ob CM in the presence of a leptin-neutralizing antibody (“Lep Ab”). (G) DNA damage in BRCA1+/− and BRCA2+/− MCF-10A cells and in (H) primary BRCA2+/− breast epithelial cells treated with insulin (100 nM) for 24 hours. (I) DNA damage in BRCA1+/− MCF-10A cells after 24-hour treatment with BMI < 25 CM, Ob CM, or Ob CM in the presence of PI3K inhibitor BKM120 (1 μM). Student’s t test was used to determine significant differences in (D) to (I). All experiments in MCF-10A cells were conducted a minimum of two times, with representative results from one experiment shown. Data in primary cells were generated from cells treated in triplicate. Data are presented as means ± SD. *P < 0.05, **P < 0.01, ***P < 0.001.
