FIGURE 1.
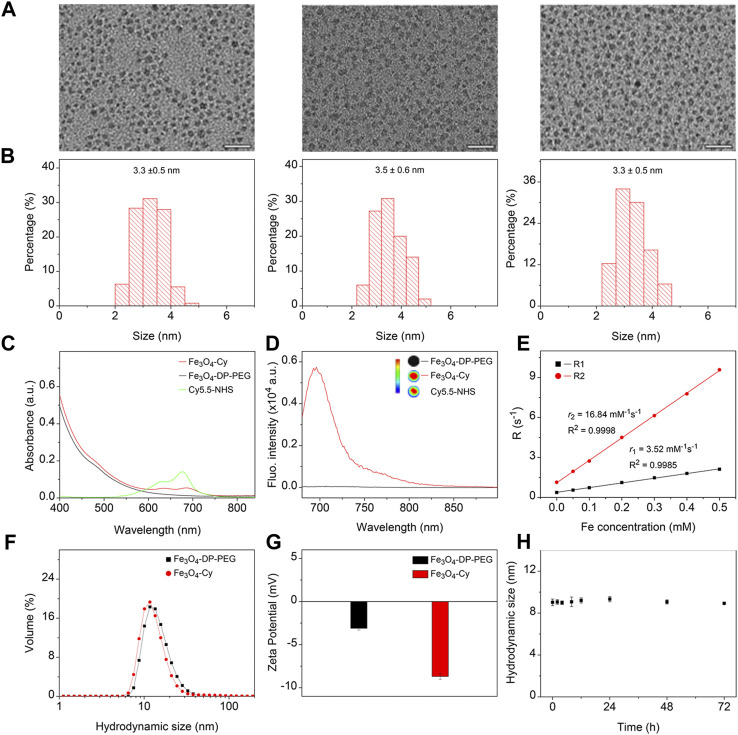
Synthesis and characterization of Fe3O4-Cy nanoparticles. (A) Representative TEM images of hydrophobic Fe3O4 nanoparticles, Fe3O4-DP-PEG, and Fe3O4-Cy, along with corresponding size histograms (B); (C) UV absorption spectra of Fe3O4-DP-PEG, Cy5.5-NHS, and Fe3O4-Cy; (D) Fluorescence images of Fe3O4-DP-PEG, Cy5.5-NHS, and Fe3O4-Cy and fluorescence spectra of iron oxide nanoparticles before and after Cy5.5 modification; (E) Plots of R1 and R2 against Fe concentrations of Fe3O4-Cy, overlaid with linear fitting curves for extracting longitudinal and transverse relaxivities; (F) Hydrodynamic size of Fe3O4-DP-PEG and Fe3O4-Cy; (G) Zeta potential of Fe3O4-DP-PEG and Fe3O4-Cy; (H) Hydrodynamic size changes of Fe3O4-Cy incubated in 10% FBS for 72 h.

