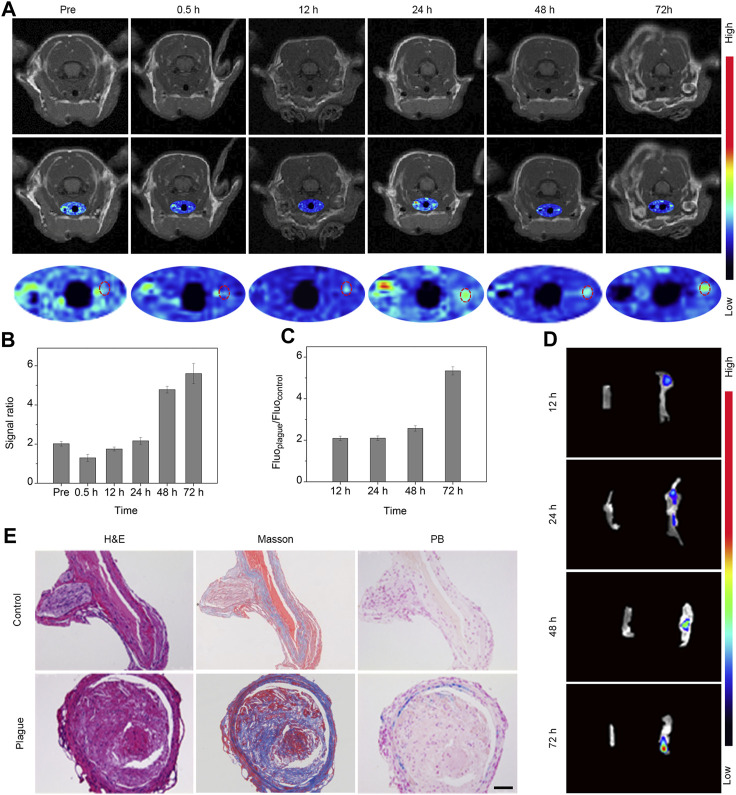
FIGURE 3.
In vivo T1 MR imaging and in vitro fluorescence imaging of carotid plaques. (A) MR images and pseudocolor maps of mice captured at different time points post intravenous injection of probes. (B) Quantitative results (signal ratio between lesion sites and control sites) of T1 signal in the region of interest following intravenous probe injection; (C) Quantitative analysis of fluorescence intensity ratio within the region of interest; (D) Fluorescence image of bilateral carotid arteries extracted from mice; (E) H&E, Masson, and Prussian blue staining of bilateral carotid arteries extracted from mice 72 h after the injection of Fe3O4-Cy. (Scale bar: 100 μm).

