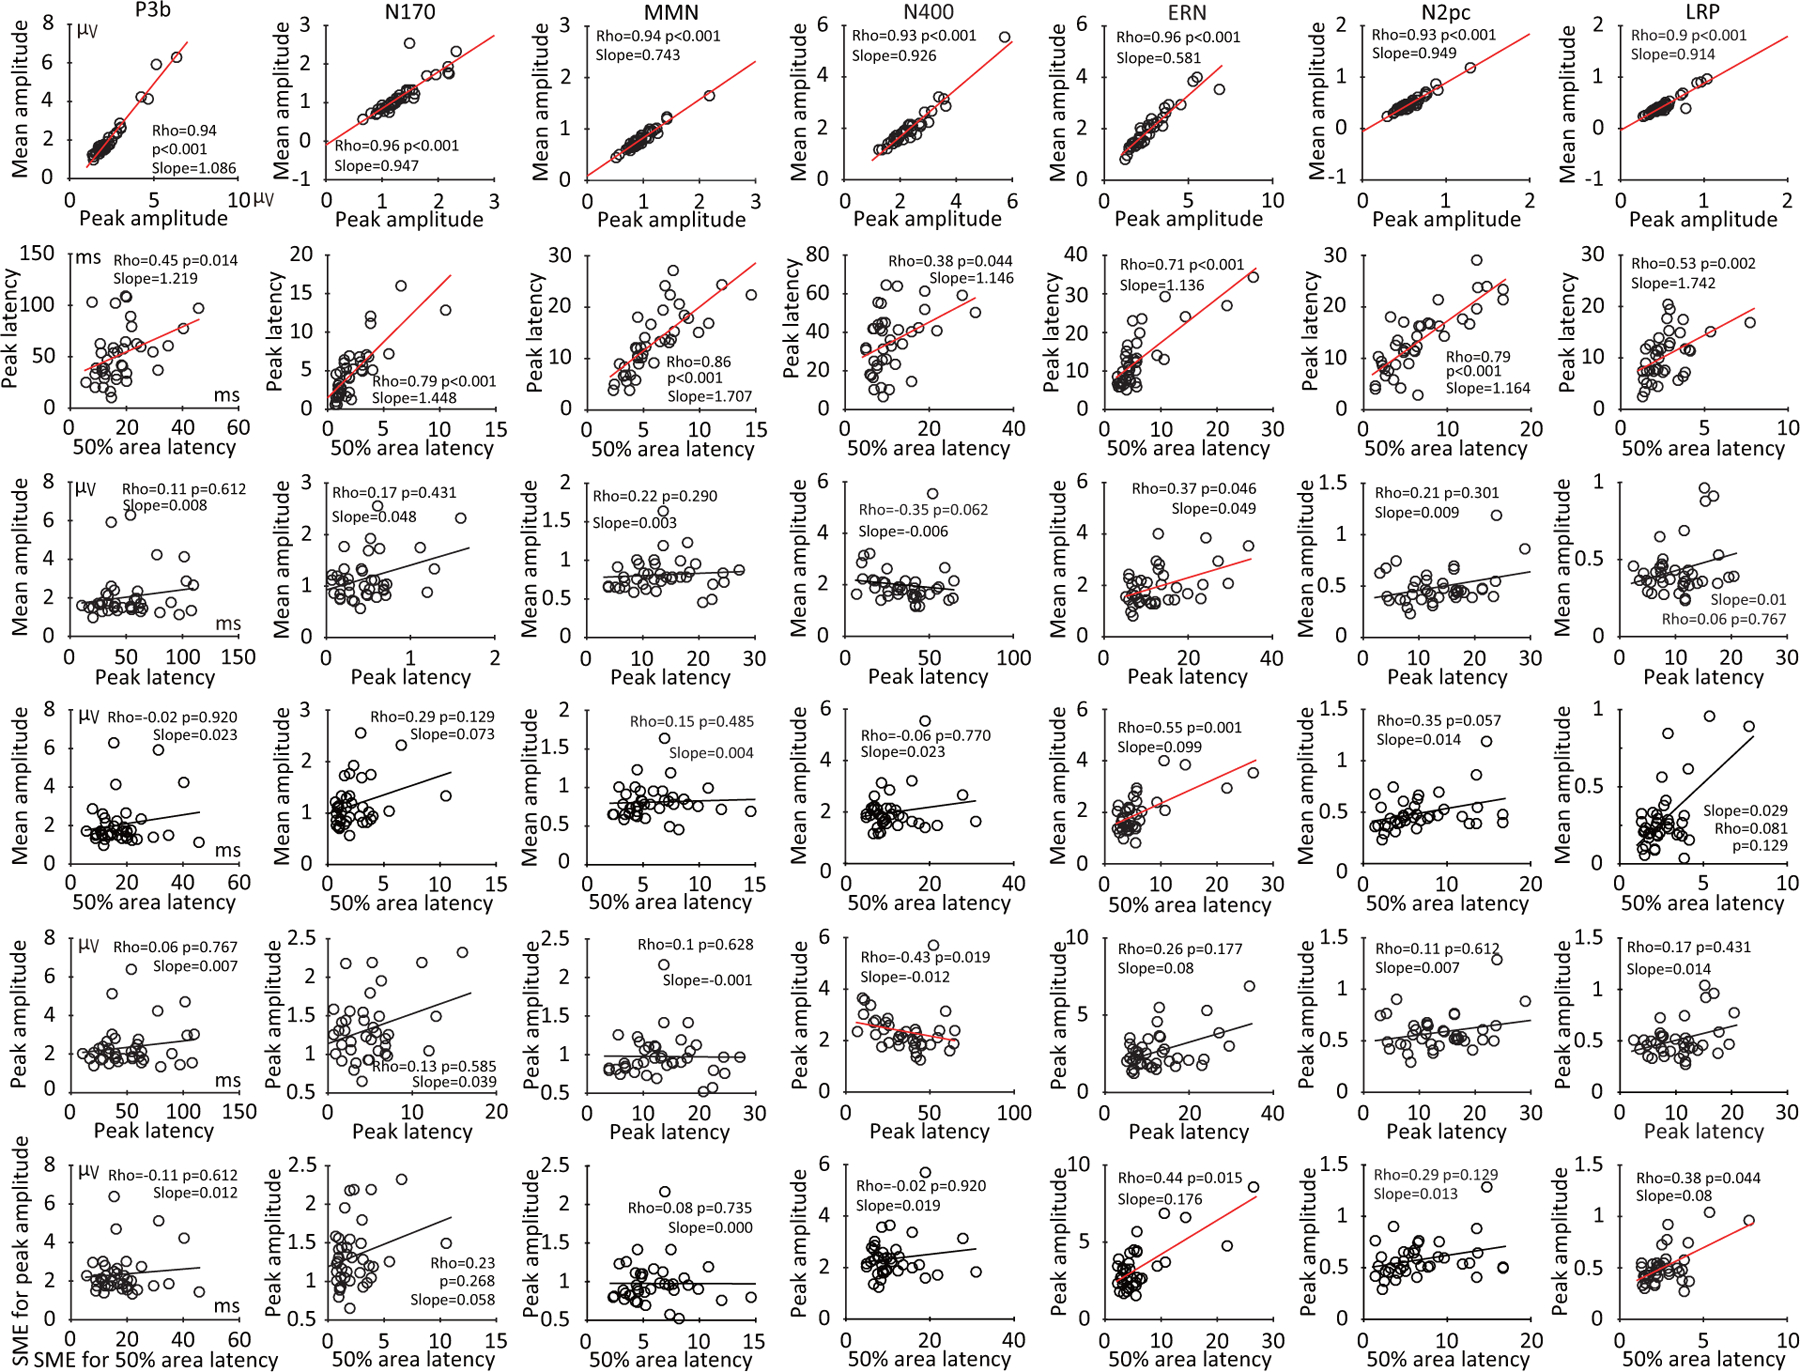
Figure 12:

Scatterplots of the relationship between standardized measurement error (SME) values corresponding to each pair of the four scoring methods (mean amplitude, peak amplitude, peak latency, and 50% area latency), separately for each component. The SME values were obtained from the difference waves. The p values were corrected for multiple comparisons across this entire family of tests.
