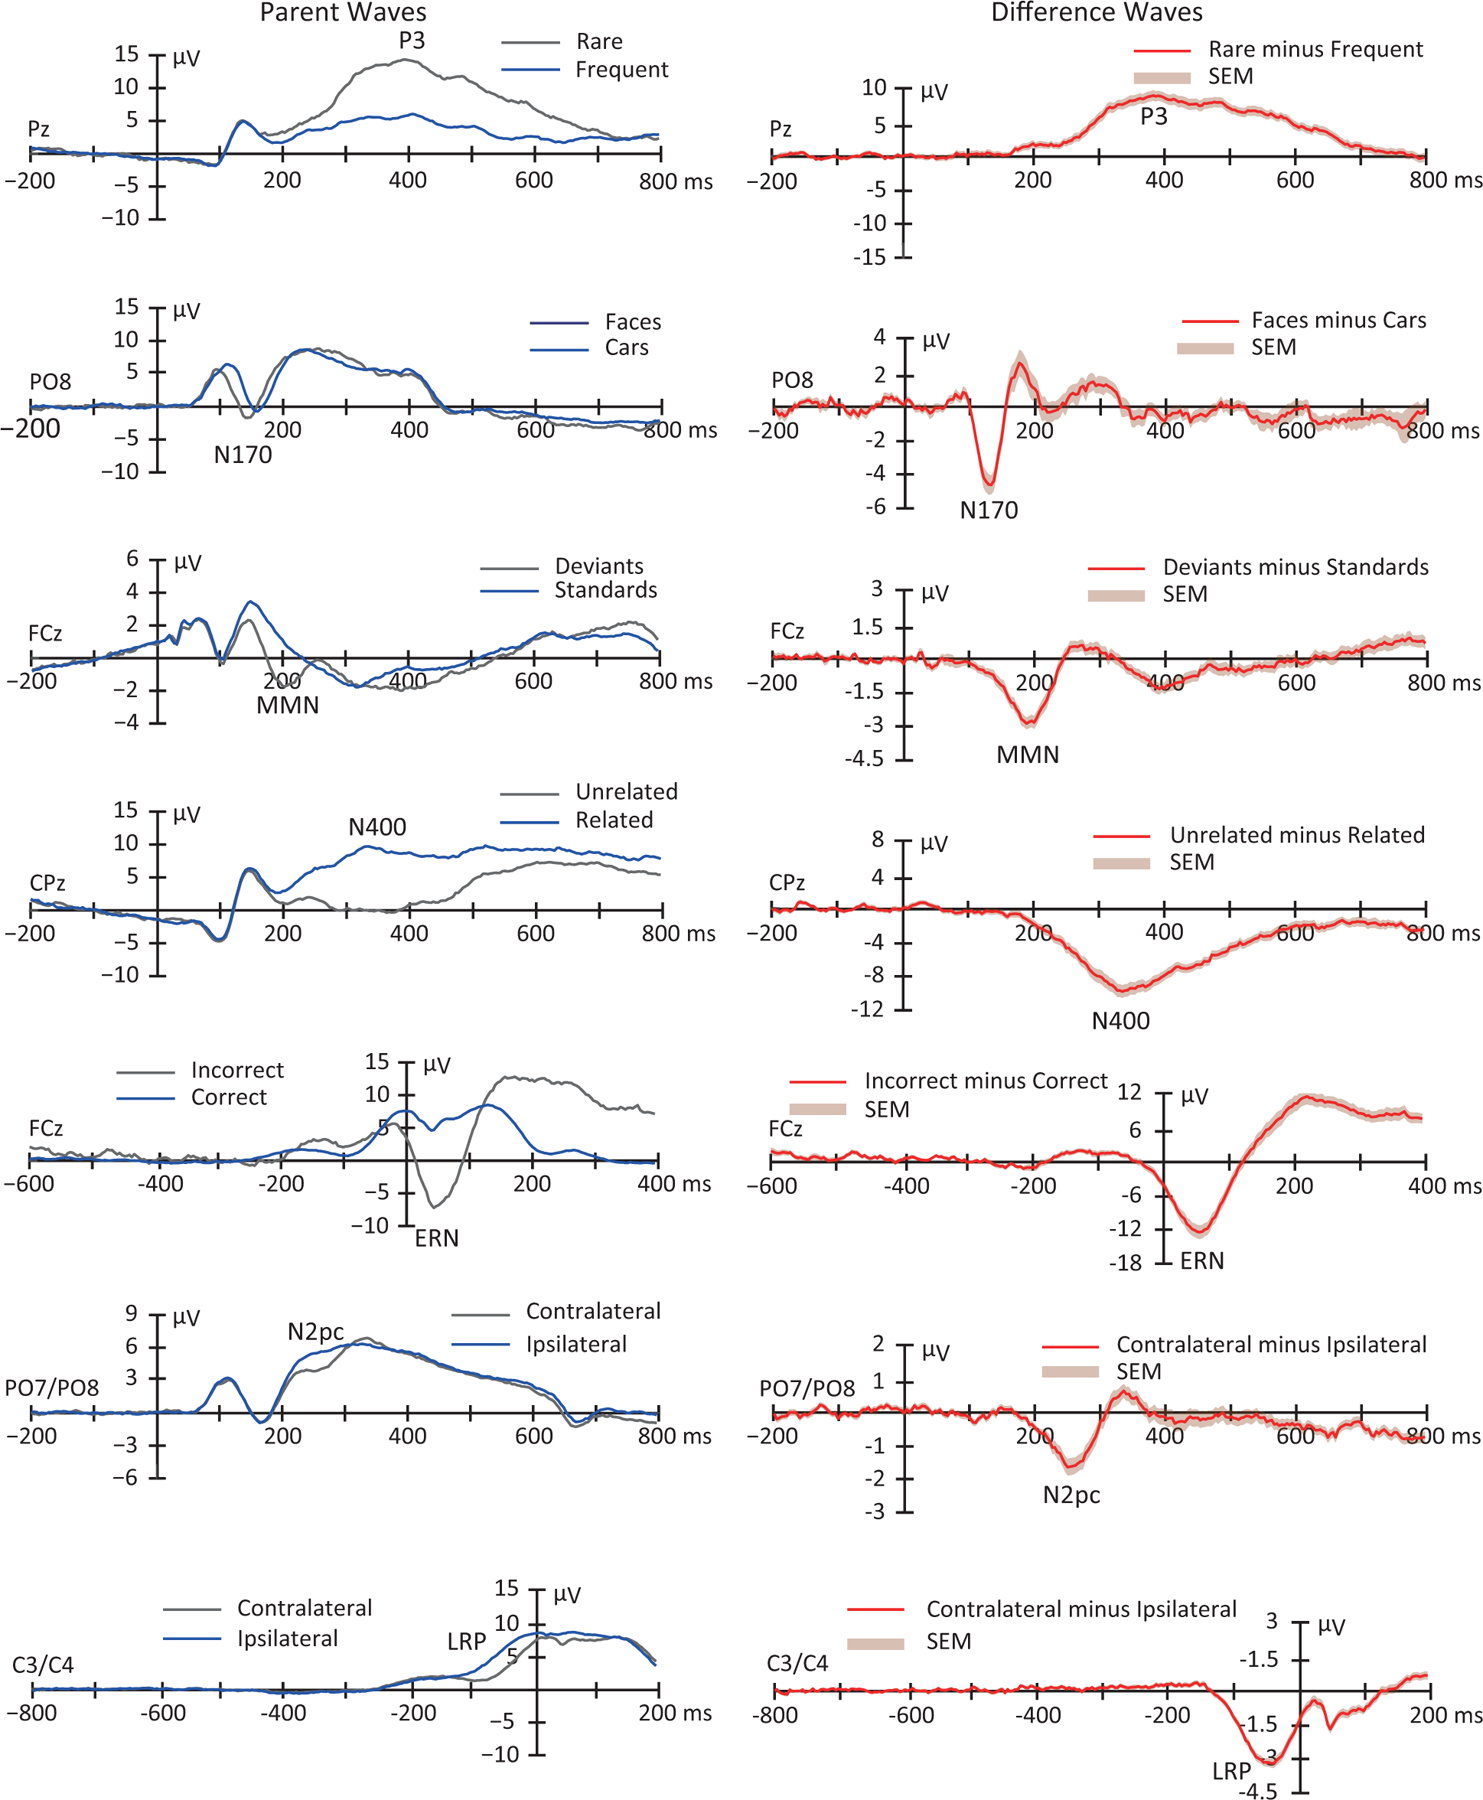
Figure 3:

Grand average parent waves (left panel) and difference waves (right panel) for the seven ERP components examined in the ERP CORE]. The shaded area accompanying the difference waves is the standard error of the mean across participants at each time point. This is largely identical to Figure 2 in Kappenman et al. (2021), except that all 40 participants were included here (except that Subject 7 was excluded from the N2pc waveforms because the number of trials for one condition was zero after artifact rejection). The original figure was released under a CC BY license (http://creativecommons.org/licenses/by/4.0/).
