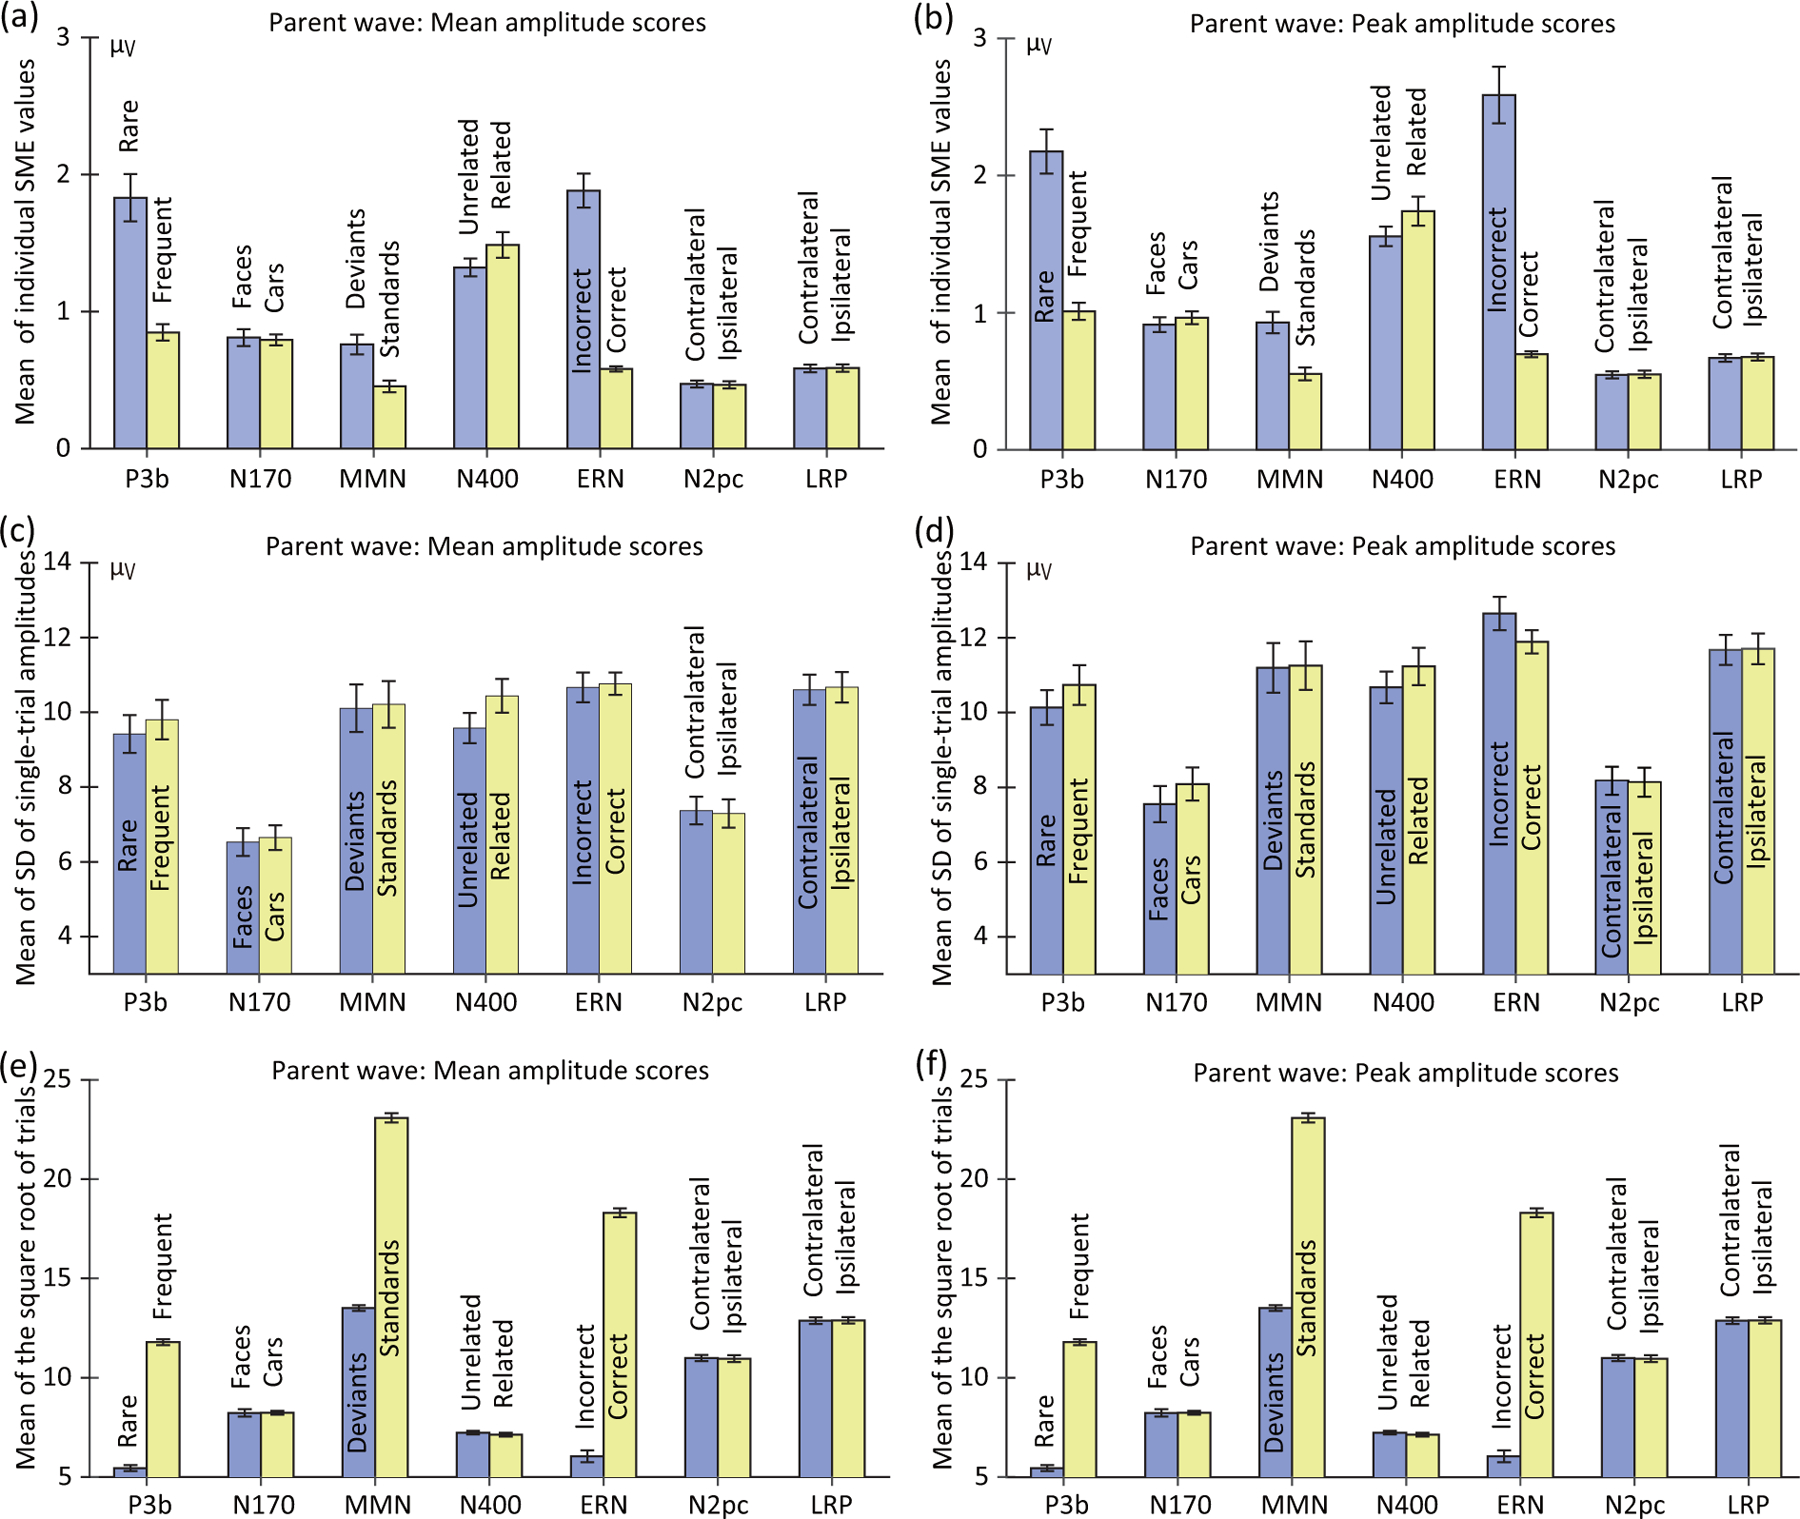
Figure 4:

Mean across participants of the standardized measurement error (SME; panels a and b), the standard deviation across trials (SD; panels c and d), and the square root of the number of trials (panels e and f). Separate values are provided for the SME values corresponding to mean amplitude scores (left column) and peak amplitude scores (right column). The mean and peak amplitude scores and corresponding SME and SD values were computed using the time windows and electrode sites shown in Table 1. Note that the number of trials varied across individuals because of artifact rejection and exclusion of trials with errors. However, panels e and f are identical because the same trials were used for the averages used for scoring mean amplitude and peak amplitude. Error bars show the standard error of the mean of the single-participant values.
