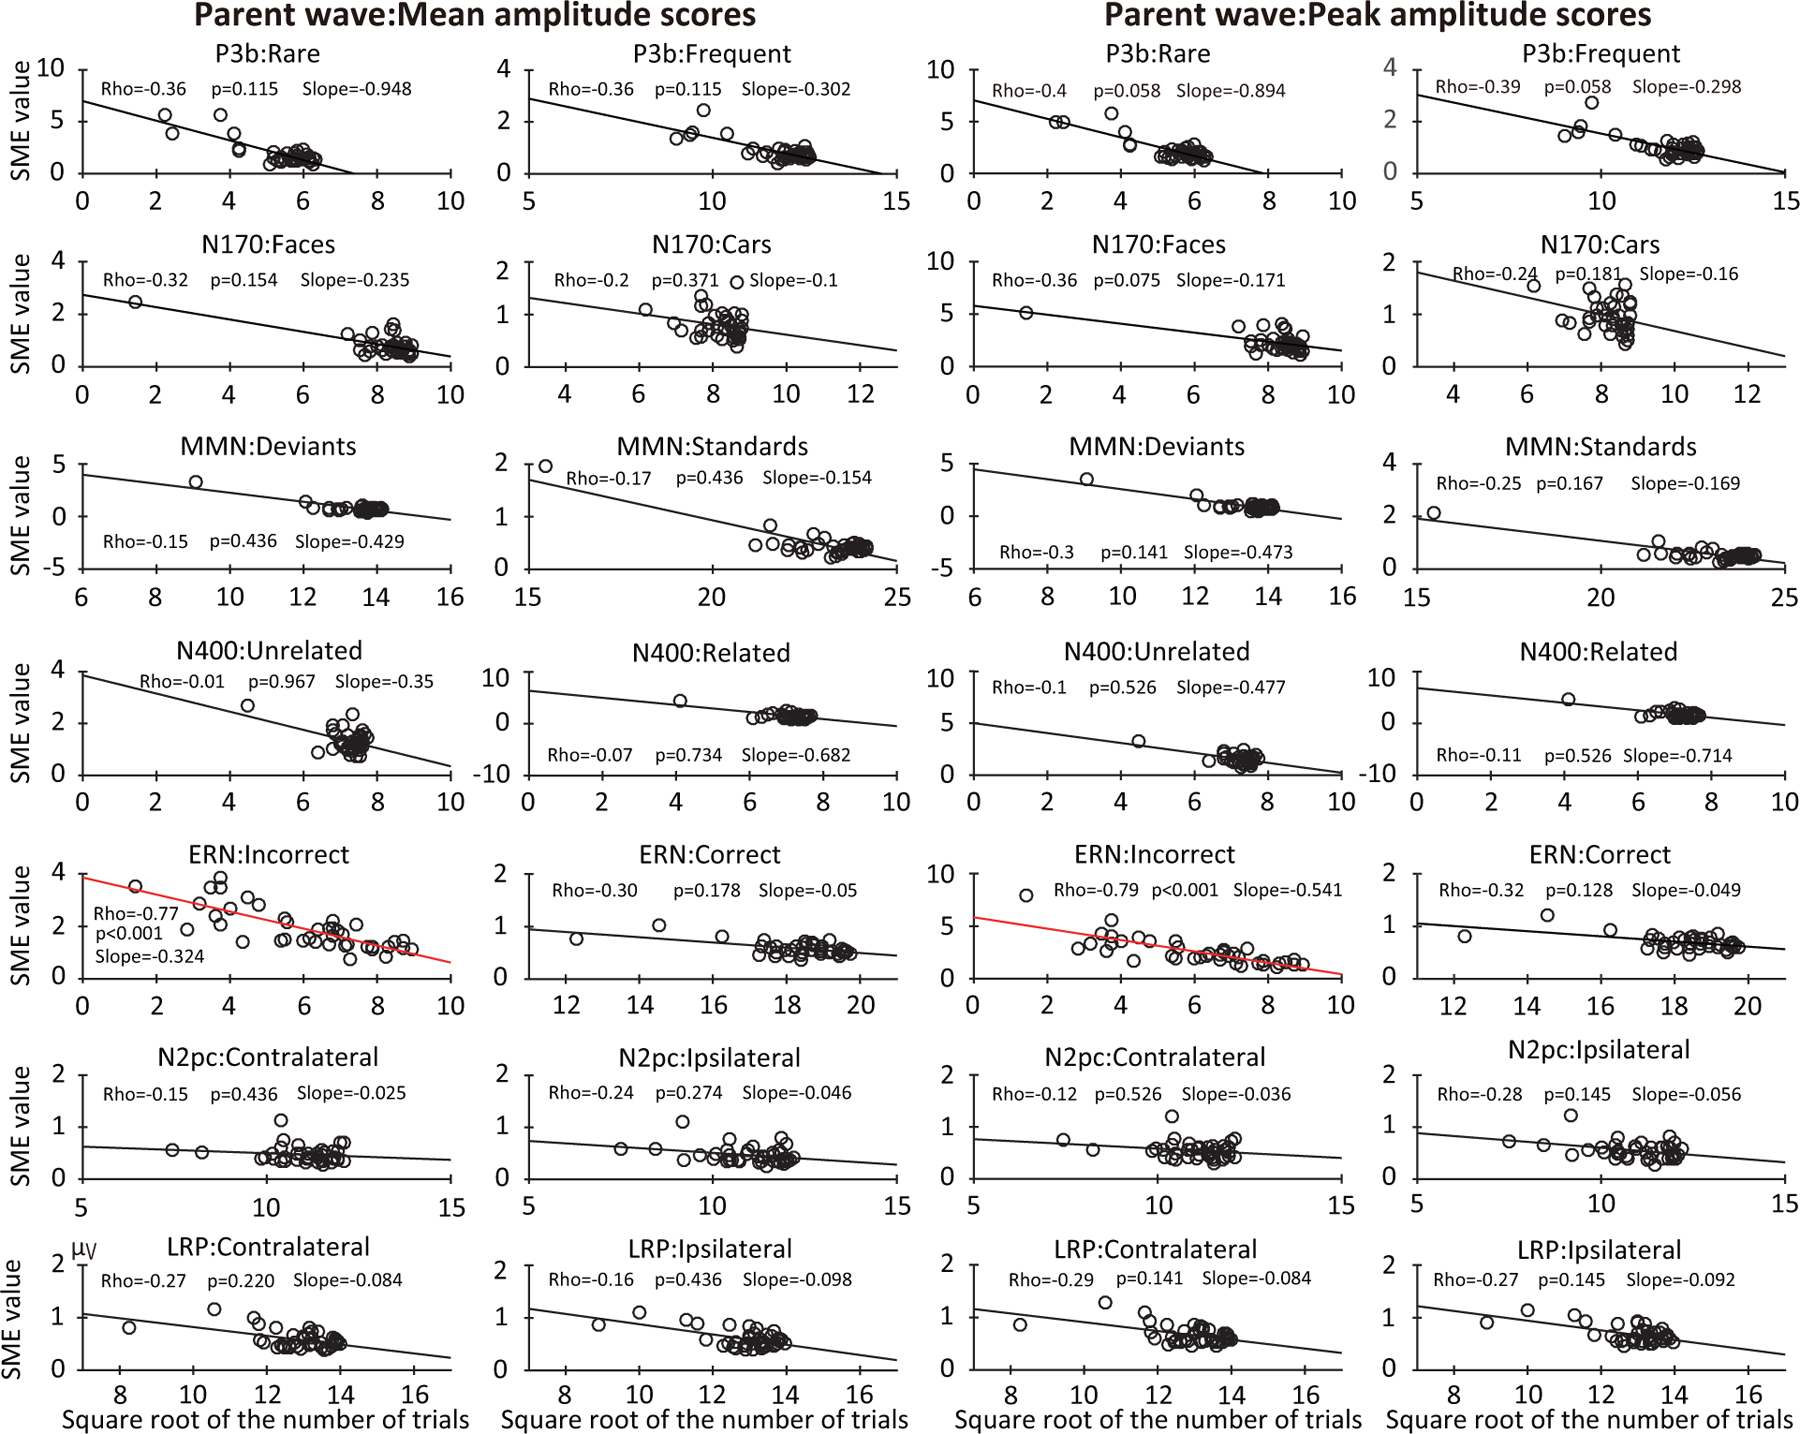
Figure 8:

Scatterplots of the relationship between the standardized measurement error (SME, obtained from the parent waves) and the square root of the number of trials after rejection of trials with artifacts and behavioral errors. Scatterplots are shown for each of the seven components, separately for each of the two experimental conditions and for mean amplitude and peak amplitude scores. Each circle represents a single participant. The p values were corrected for multiple comparisons across the family of tests for each scoring method.
