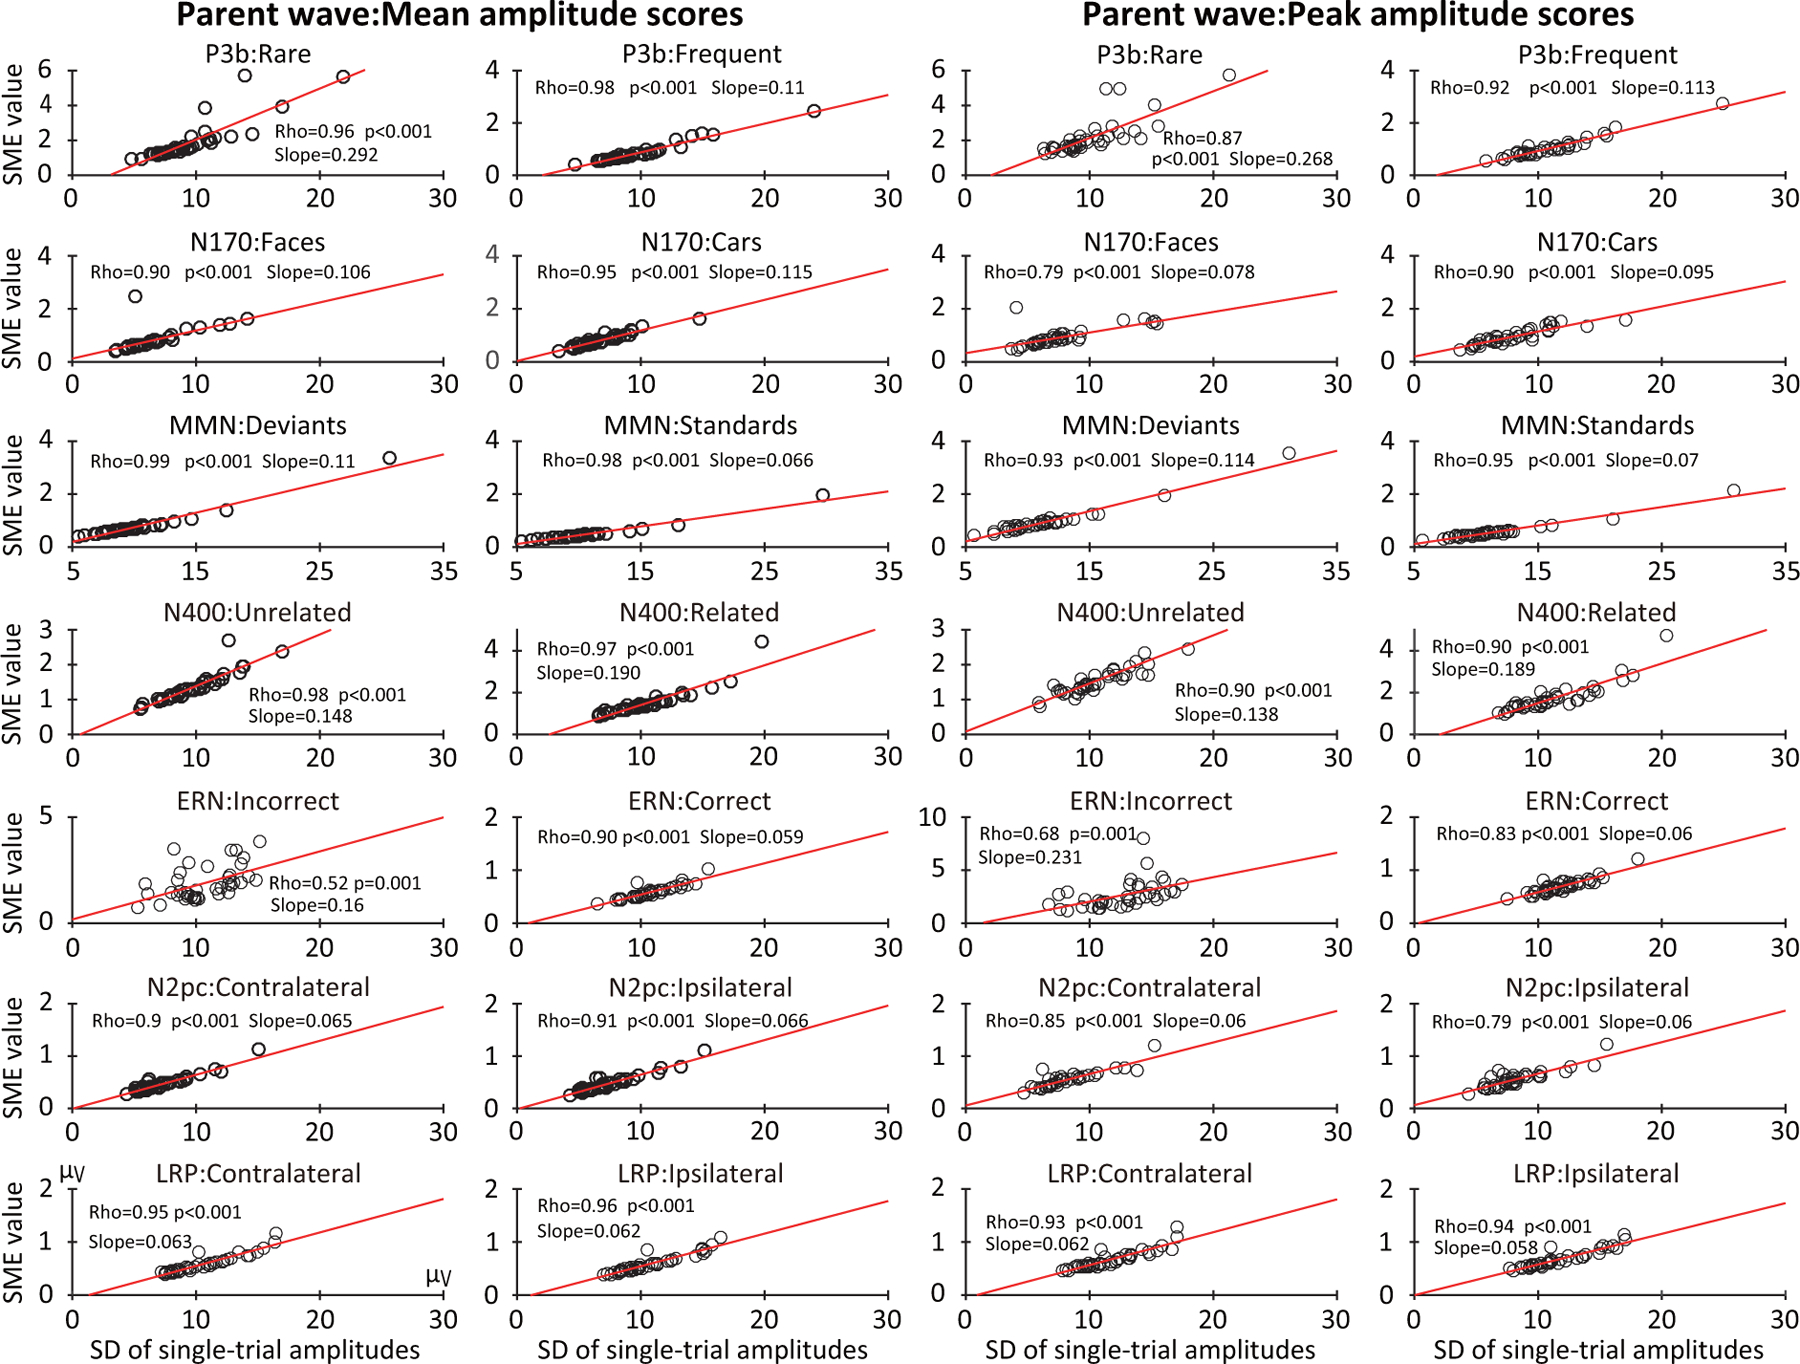
Figure 9:

Scatterplots of the relationship between the standardized measurement error (SME, obtained from the parent waves) and the standard deviation (SD) of the single-trial scores for mean amplitude and peak amplitude scores. Scatterplots are shown for each of the seven components, separately for each of the two experimental conditions. Each circle represents a single participant. The p values were corrected for multiple comparisons across the family of tests for each scoring method.
