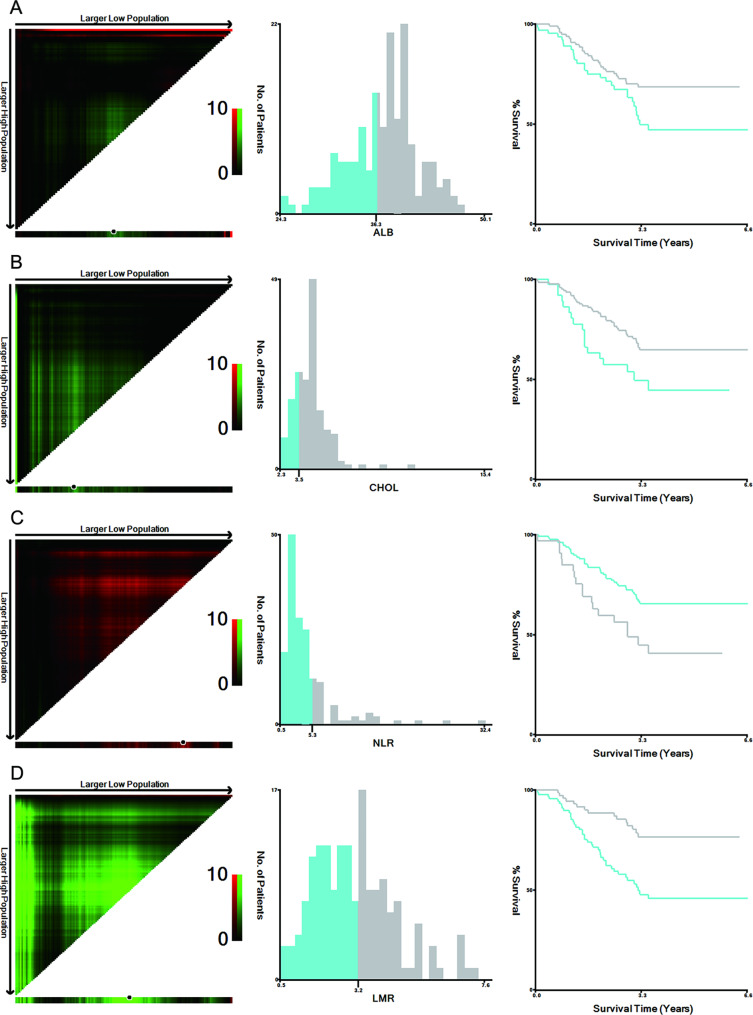
Fig. 2.
Optimal cut-points of ALB, CHOL, NLR, and LMR were determined by X-tile analysis. The plot shows the χ2 log-rank values produced when dividing the cohort with optimal cut-points, producing high and low population. X-tile plots are shown in the left panels, red coloration of cut-points indicates an inverse correlation with survival, whereas green coloration represents direct associations. The optimal cut-point highlighted by the black circle in the left panels is shown on a histogram (middle panels), and Kaplan–Meier plots are presented in right panels. In terms of overall survival, the optimal cut-points of ALB (A), CHOL (B), NLR (C) and LMR (D) were 36.3, 3.48, 5.33, and 3.19, respectively

