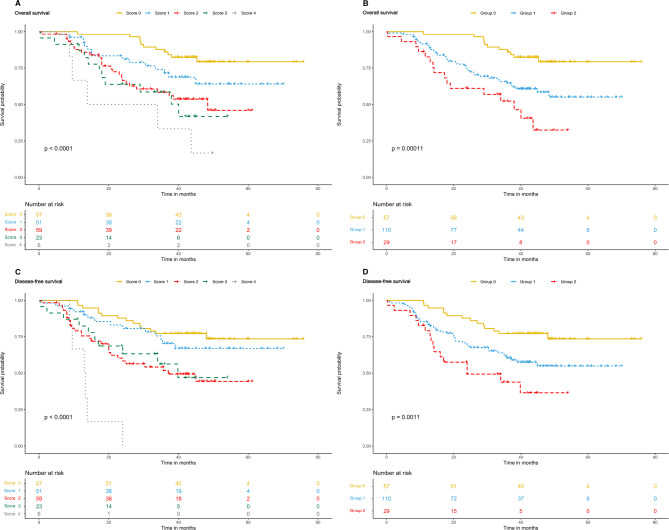
Fig. 3.
Kaplan–Meier survival analysis according to Modified Naples Prognostic Score and group. (A) Significant differences in the overall survival among patients were found with five scores (P < 0.0001). (B) Significant differences in the overall survival among patients were found with three score groups (P = 0.0001). (C) Significant differences in the disease-free survival among patients were found with five scores (P < 0.0001). (D) Significant differences in the disease-free survival among patients were found with three score groups (P = 0.0011)

