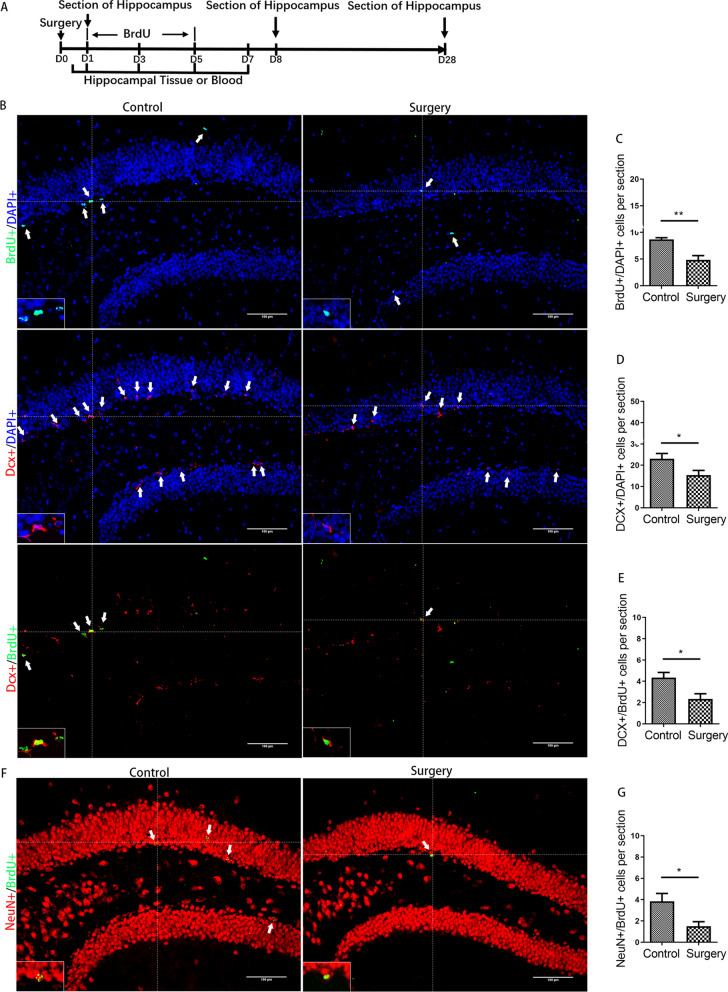
Fig. 2.
Surgery induced inhibition of neurogenesis in the hippocampus. A Experimental protocol diagram; B representative immunofluorescence images of BrdU +, Dcx + and Dcx + /BrdU + cells (200 ×); C–E quantitative analysis of BrdU +, Dcx + and Dcx + /BrdU + cells; F representative immunofluorescence images of NeuN + /BrdU + cells (200 ×); G quantitative analysis of NeuN + /BrdU + cells. Scale bar = 100 µm. The image at the bottom left showed a magnification of the crosshair position (400 ×). N = 6/group. D, day post operation. *p < 0.05, **p < 0.01

