Figure 4.

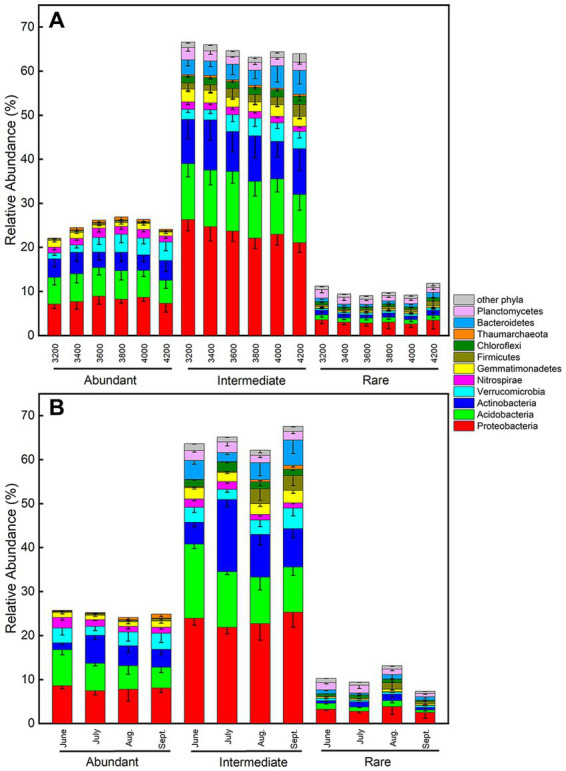
Relative abundances of phyla for abundant, intermediate and rare subcommunities (A) along the elevational gradient and (B) during the growing season. Error bars represent standard deviations (n = 6).

Relative abundances of phyla for abundant, intermediate and rare subcommunities (A) along the elevational gradient and (B) during the growing season. Error bars represent standard deviations (n = 6).