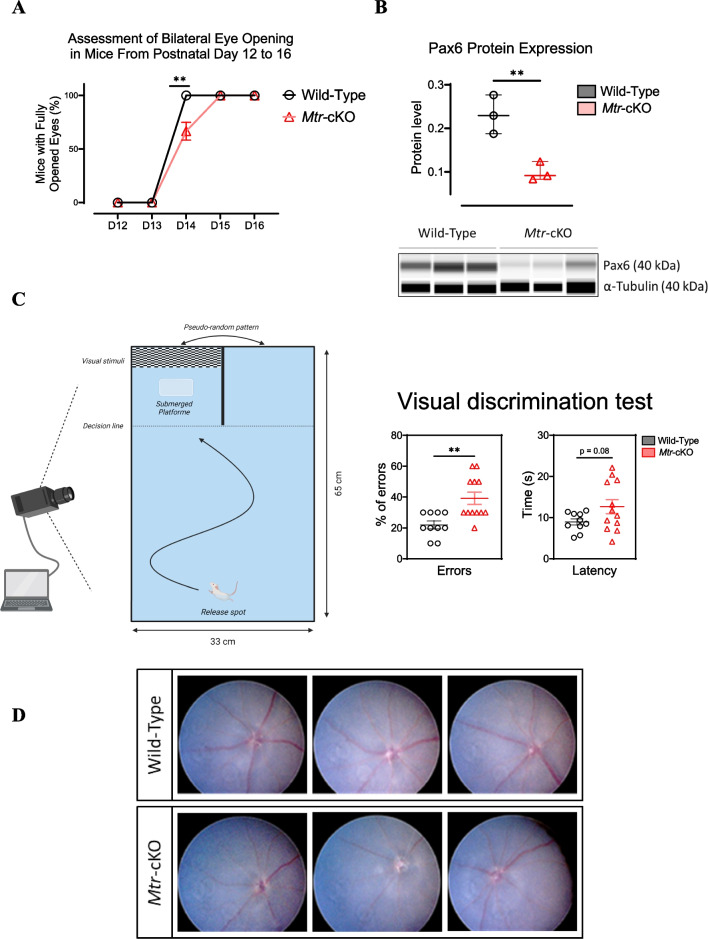
Fig. 2.
Ocular phenotyping of Mtr-cKO mice and fundus examination. A Assessment of bilateral eye opening from postnatal day 12 to 16. B Quantification levels of Pax6 protein in retinal tissue using WES Simple Protein. α-tubulin serves as an internal control for protein expression, and densitometric analysis of the WES assay provides quantification of protein expression. C Schematic representation of the visual acuity test conducted on postnatal day 21 and visual acuity test results including the percentage of failures during the test and latency to find the platform. N = 12/group. Data are presented as means ± SEM. Statistical analysis was performed using Student t test (*P < 0.05, **P < 0.01, ***P < 0.001). (Created with BioRender.com). D Fundus examination of the dilated eye using the AIDA Compact II system. Data represent means ± SEM. Statistical analysis was performed using the Student t test (*P < 0.05, **P < 0.01, ***P < 0.001). N = 3 to 12 mice per group

