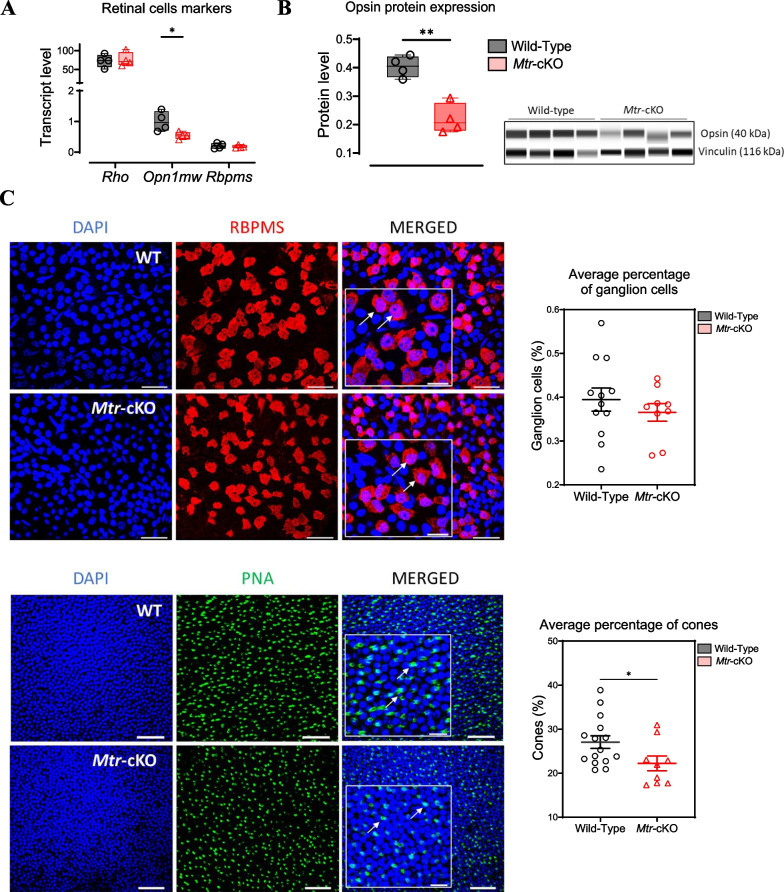
Fig. 6.
Analysis of retinal cell type in Mtr-cKO mice compared to wild type. A Quantification of mRNA levels for Rho, Opn1mw, and Rbpms genes in retinal tissue using RT-qPCR. B Analysis of protein levels for Opsin protein in retinal tissue using WES Simple Protein. Vinculin was employed as an internal control for protein expression. Densitometric analysis of the WES assay provides quantification of protein expression. C Immunostaining of retinal ganglion cells and cones using specific labeling for RBPMS and PNA, respectively, on flat-mounted retinas of wild type and Mtr-cKO mice. Examples of labeling are indicated by arrows. The scale bars in the main pictures represent 10 µm, while the scale bars in the insets denote 5 µm. The average percentages of retinal ganglion cells and cones are presented in the histograms. Data represent means ± SEM. Statistical analysis was performed using the Student t test (*P < 0.05, **P < 0.01, ***P < 0.001). N = 3 to 5 mice per group

