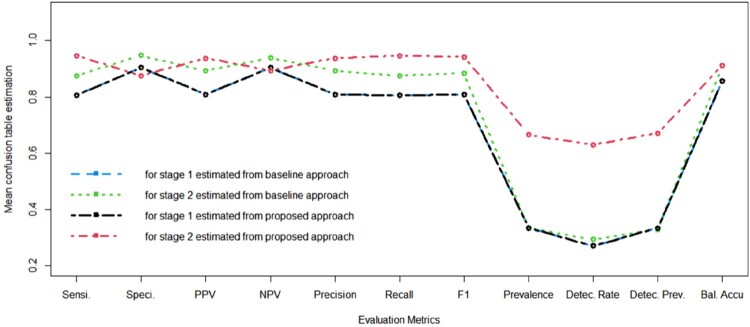
Figure 5.
Mean prediction metrics for 2 stages with coefficients estimated from baseline approach individually (blue and green line), and coefficients estimated from proposed method jointly (red and black line). Note that the blue and black lines are too close to each other to distinguish them from each other visually. The red line is almost higher than the green line in every dimension, demonstrating the advantages of the proposed method.

