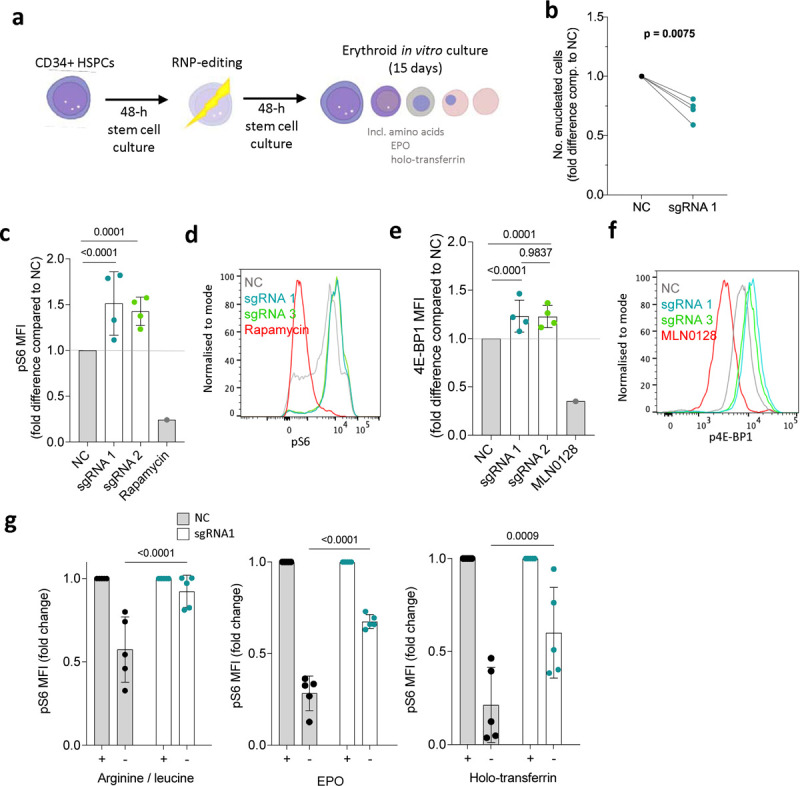
Figure 2. NPRL3-KO impairs primary human in vitro erythroid differentiation and erythroblast mTORC1 signalling.

a) Schematic illustration: following extraction of human peripheral blood mononuclear cells, magnetic assisted cell sorting MACS was used to isolate CD34+ HSPCs. After a 48-h rest and expansion period, RNP-editing was performed to knockout NPRL3. After another rest period, the edited cells were exposed to an erythroid differentiation culture. b) Fold difference in the average number of enucleated cells formed by NPRL3-KO progenitors compared to NC by day 14. Four individual donors are indicated, and each pair of connected points represents the average from one individual, and each average is represented by the geometric mean. Analysed by one-tailed ratio paired t-test. c) pS6 median fluorescent intensity (MFI) measured 24 h post-media change by flow cytometry, also represented in d) using a histogram. e) p4E-BP1 MFI measured 24 h post-media change, also represented in f) using a histogram. . Rapamycin and MLN0128 were included to indicate the dynamic scope of mTORC1 signalling measurable by pS6 MFI. Data are expressed as the mean ± SD. Fold reduction in pS6 MFI upon 4-h withdrawal of e) arginine and leucine, f) EPO and g) holo-transferrin, measured on day 11. Each point represents an individual donor. Analysed by Two-way ANOVA followed by Tukey’s test.
