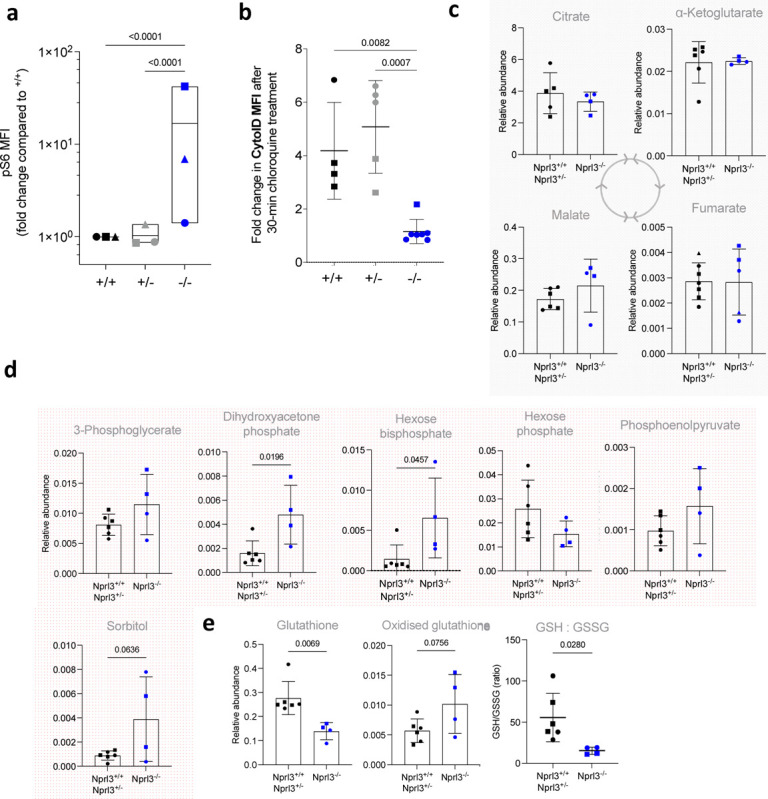
Figure 3. Metabolic effects of Nprl3−/− in E13.5 fetal liver.

a) pS6 MFI measured in S2 fetal liver erythroblasts (fold change compared to Nprl3+/+), following a 2-h 37°C incubation in RPMI with 5% FCS (otherwise un-supplemented). Each symbol indicates the average of the indicated genotype in one litter (n = 3 litters). Plotted on a log scale for visualisation. Analysed by Two-way ANOVA followed by Tukey’s test (performed on litter averages due to high baseline variability between experiments; this could be due to temporal instrumental variation of the flow cytometer used, or the speed of sample processing). b) Autophagic flux in S2 erythroblasts, as interpreted by difference in the MFI of Cyto-ID (an autophagosome dye) between untreated cells and cells treated with an inhibitor of autophagosome formation for 30 min. Each symbol indicates an embryo. Data are expressed as the mean ± SD. Analysed by One-way ANOVA followed by Tukey’s test. Relative abundance of c) glycolysis and d) Krebs cycle intermediates, in Nprl3−/− Ter119+ cells versus littermates, measured by LC-MS. e) GSH:GSSG ratio, calculated from relative abundances of glutathione and oxidised glutathione. All LC-MS measurements were normalized to the abundance of myristic acid, employed as an internal control. All LC-MS data were compared by two-tailed t-test.
