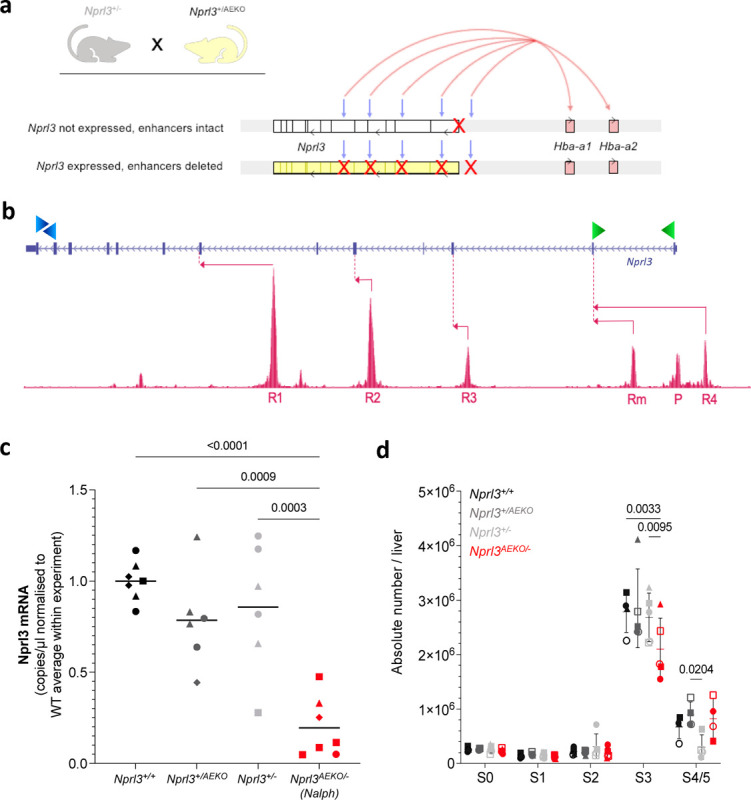
Figure 4. Elimination of interactions between the Nprl3 promoter and α-globin enhancers.

a) Schematic illustrating the alleles inherited by the Nalph genotype, which is heterozygous for both the Nprl3 promoter deletion, and deletion of all α-globin enhancers. Grey arrows indicate the enhancer locations, and red arrows indicate enhancer induction of sufficient α-globin expression on one allele. b) Schematic illustrating the digital droplet assay design, with primer locations indicated by green (promoter-derived mRNA) and blue (mRNA + meRNA) arrowheads. Pink arrows indicate transcription starting from enhancers and their first splicing point. c) Promoter-specific Nprl3 mRNA expression in Nalph S3 erythroblasts compared to littermates (n = 4 litters). Analysed by One-way ANOVA followed by Tukey’s test. Each point represents an embryo, with litter represented by shape. d) Absolute number of erythroid cells in stages S0–S5 of differentiation in fetal livers of Nalph embryos vs. littermates (n = 5 litters). Data expressed as median with range. Analysed with by Two-way ANOVA followed by Tukey’s test.
