
Extended Data. Fig. 1. Effects of Nprl3−/− in the fetal liver and in competitive chimaeric mice.
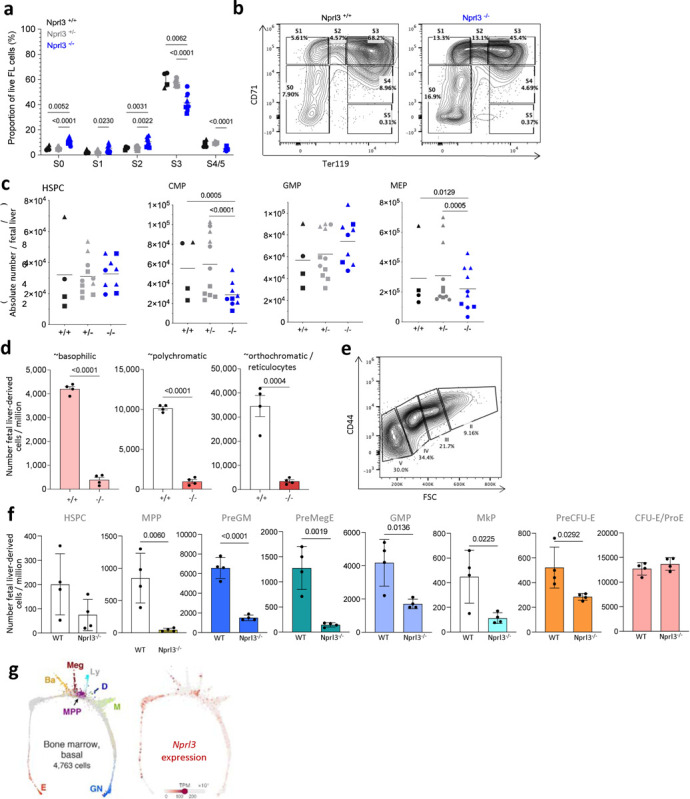
a) Erythroid stages as a proportion of total live fetal liver cells according to genotype (n = 3 litters). Points indicate individual embryos. Data are expressed as the mean ± SD. Analysed by Two-way ANOVA followed by Tukey’s test. b) Example gating of erythroid stages in the fetal liver at E13.5. c) Absolute number per fetal liver of: total c-kit+ cells of lineage- Sca-1+ HSPCs, CD34+ CD16/32+ GMPs, CD34+ CD16/32- CMPs and CD34- CD16/32- MEPs (n = 5 litters). Each point represents an individual embryo, and litter indicated by shape of point. Data are expressed as the mean ± SD, and analysed by Two-way ANOVA (grouped by litter) followed by Tukey’s test. d) Absolute number of erythroblasts in stages II, II and IV derived from either WT or Nprl3−/−fetal liver cells, per million recipient bone marrow cells. Analysed in recipient bone marrow at week 16 post-transplantation (n = 8 mice per group). Data analysed by two-tailed t-test, and expressed as the mean ± SD. e) Example gating of erythroid stages in the bone marrow. f) Absolute number of fetal liver-derived (CD45.2+ Tomato-) progenitors per million recipient bone marrow cells at week 16 post transplantation (n = 4 mice per group). Data analysed by two-tailed t-test, and expressed as the mean ± SD. g) Single cell RNA-Seq measured from mouse bone marrow-derived cells. Adapted from an online tool published in Tusi et al. 2018. https://kleintools.hms.harvard.edu/paper_websites/tusi_et_al/.