
Extended Data. Fig. 4. Further characterisation of the Nprl3-α-globin transcriptional hub.
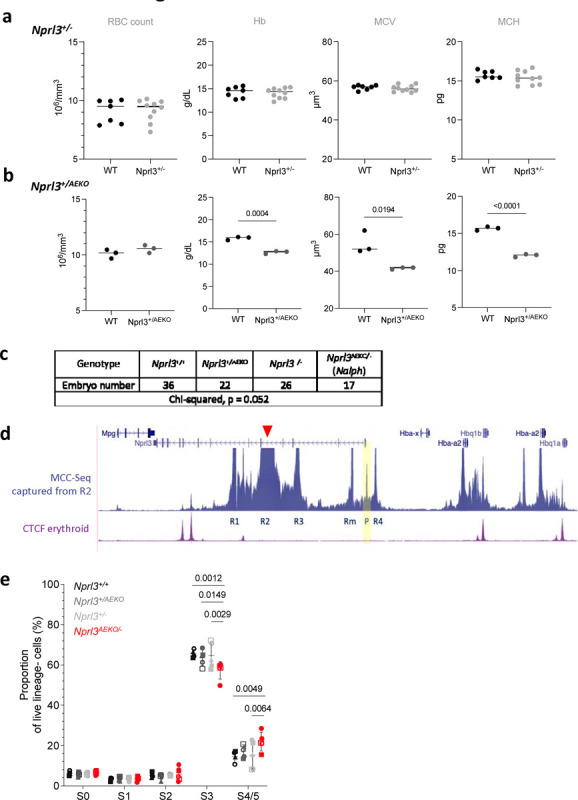
a, b) Peripheral blood measurements (RBC count, Haemoglobin (Hb), mean corpuscular volume (MCV) and mean corpuscular haemoglobin (MCH)) of a) Nprl3+/−, and b) Nprl3+/AEKO adults and their littermate WT controls. Analysed by two-tailed t-test. Data expressed as the mean ± SD.c) Number of embryos of each genotype across 12 litters of Nprl3+/− and Nprl3+/AEKO animal crosses. d) MCC-Seq snapshot captured from the R2 enhancer (anchor point indicated by red arrowhead). Yellow panel highlights the interaction of the R1 enhancer with the Nprl3 promoter (P). e) Proportions of erythroid cells in stages S0–S5 of differentiation in fetal livers of Nalph embryos vs. littermates (n = 5 litters). Data are expressed as the mean ± SD. Analysed by Prism Mixed-effects followed by Tukey’s test. Each point represents an embryo, with litter represented by shape.