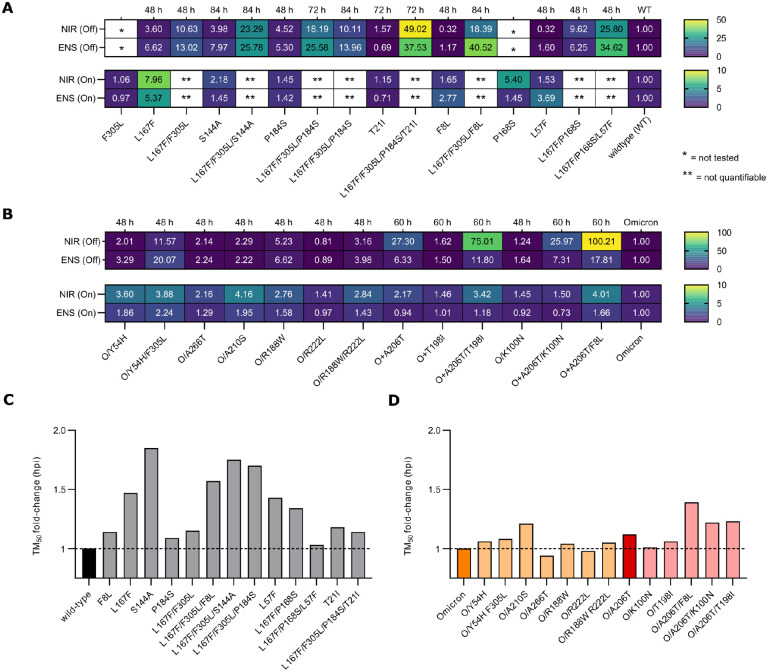
Fig. 3. Resistance data and viral replication kinetics of WT, Omicron and mutant main proteases.
Rectangular fields with one and two stars represent constructs/variants that have not been tested or for which IC50 values were not quantifiable, respectively. Hours after infection / hours post infection (hpi). (A) Heat maps of IC50 fold-changes of Mpro-On (bottom) and Mpro–Off (top) dose responses for nirmatrelvir and ensitrelvir. (B) Heat maps of IC50 fold-changes for Omicron-Mpro-On (bottom) and Omicron-Mpro–Off (top) dose responses for nirmatrelvir and ensitrelvir. (C) Bar plot of TM50 fold-changes vs the WT protease. The WT Mpro is coloured in black. (D) Bar plot of TM50 fold-changes vs Omicron (orange) and Omicron/A206T (bordeaux) proteases. Variants are coloured in light orange and light bordeaux according to the parental protease from which they originated.

