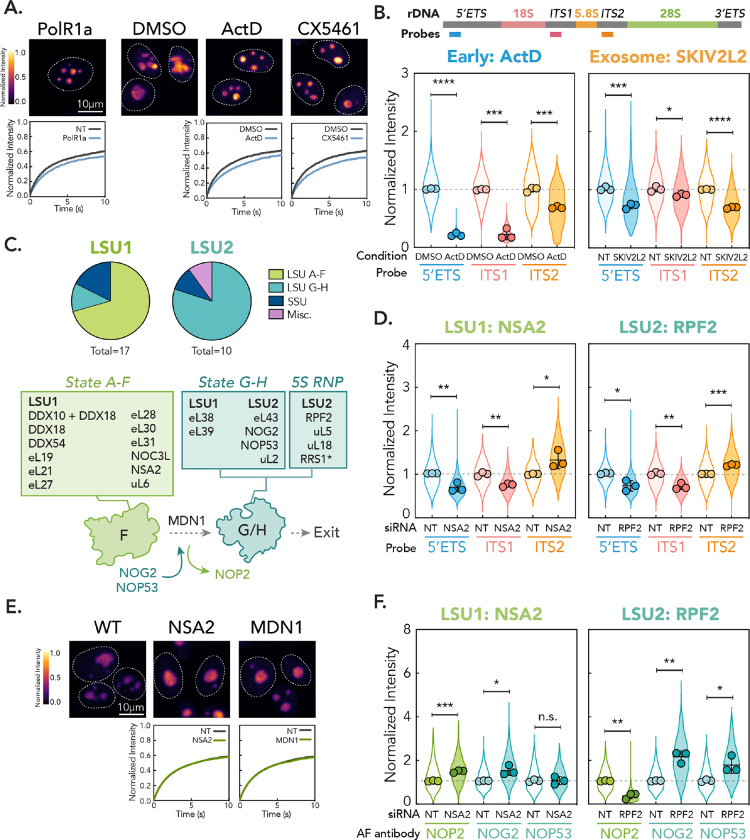
Figure 4: Distinct nucleolar phenotypes are associated with discrete stages in ribosome biogenesis.
(A) Comparison between PolR1a knockdown (Early cluster) phenotype and treatment of cells with Pol I inhibitors (0.04 μg/mL ActD and 500 nM CX5461 for 2 hr). Images are scaled equally and colored with mpl-inferno LUT to show relative intensity differences. FRAP curves for NT/vehicle control vs. gene depletion/drug shown (n = 250 nucleoli, error bars are 95% CI). (B) rRNA FISH for Early (ActD) and Exosome cluster (knockdown of SKIV2L2). Schematic shows position of probes in 47S rRNA. Violin plots show spread of individual data points across three biological replicates (n = 600 nucleoli per replicate, points represent means of replicates, error bars are SD). The dotted line shows non-targeting control level. p-values calculated using two-tailed unpaired t-test between biological replicates. * p < 0.05, ** p<0.01, *** p < 0.001, **** p<0.0001. (C) Mapping genes in LSU1 and LSU2 phenotypic clusters onto LSU intermediates and schematic of State F to G transition. * = RRS1 associates in State A-F but is critical in 5S RNP recruitment. (D) rRNA FISH for representative hits in LSU1 (NSA2) and LSU2 (RPF2) gene clusters, as in (B). (E) Comparison of LSU1 cluster hit NSA2 and knockdown of MDN1. Images are scaled equally and colored with mpl-inferno LUT to show relative intensity differences. FRAP curves for NT vs. gene depletion shown (n = 250 nucleoli, error bars are 95% CI). (F) Nucleolar immunofluorescence of LSU intermediate markers for LSU1 and LSU2 representative gene hits. Three biological replicates were performed (n = 600 nucleoli per replicate, spread of individual nucleoli shown as violin, error bars are SD). Dotted line shows non-targeting control level. p-values calculated using two-tailed unpaired t-test between biological replicates. n.s. = not significant, * p < 0.05, ** p<0.01, *** p < 0.001.

