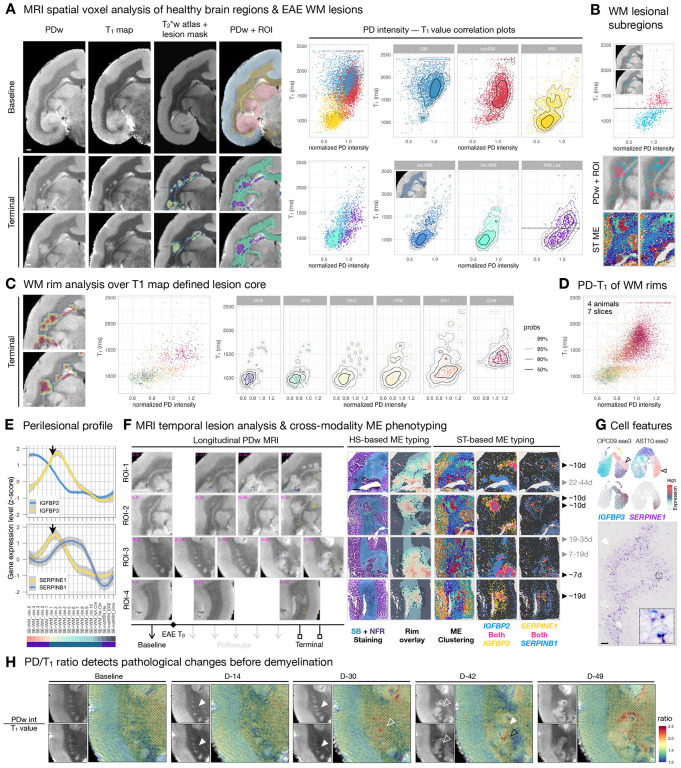
Fig5. MRI features distinguish lesion subregions, mark the trajectory of white matter (WM) pathology, and phenotype lesion microenvironments (ME) with temporal significance.
(A) Left: To identify MRI features that could inform lesion dynamics, proton density-weighted (PDw) images and T1 maps acquired in the same imaging session were registered to a T2*w MRI atlas at baseline and terminal time points. The lesion masks were created by subtracting the normalized baseline intensity value from the terminal PDw image and then overlaid onto the registered T2*w MRI atlas (FigS4 and Methods). The regions of interest (ROI) consist of atlas-annotated anatomical structures and lesion subregions, which were used to group and color-code each voxel and then overlaid onto PDw images for visualization. Scale bar = 1mm. Right: Scatter plots with density contours (legend in (C)) show the correlation of PDw intensity and T1 value (PD-T1) for each voxel across ROI, as indicated on overlaid PDw images. As expected, cortical gray matter (GM) and subcortical gray matter (subGM) have higher T1 value (longer longitudinal relaxation time) than WM. The normal appearing WM (NA.WM) and WM lesion (WM.Les) areas from the terminal PDw image (bottom) are compared against the equivalent areas (He.WM) at baseline (demonstrated in the inset). The PD-T1 distribution of NA.WM largely agrees with He.WM, but there is a horizontal shift in PDw intensity and a vertical split in T1 values (T1 = 1250, annotated by a horizontal dashed line) into two populations for WM.Les.
(B) Top: A cutoff T1 value of 1250 ms (horizontal dashed line) was applied to WM.Les voxels, which are color-coded accordingly on the scatter plot and the overlaid PDw image (inset). Bottom: The subregional structure of PD-T1 values resembles that identified by spatial transcriptome ME clustering. Voxels with high T1 values typically reside at the lesion core, whereas voxels with low T1 values primarily populate the lesion edge.
(C) 5 concentric rims, outward from the PD-T1 defined lesion core, color WM subregions on the PDw image and scatter plots. The PD-T1 distribution of the rim5 area (750 μm away from the lesion core) is similar to that of He.WM, while PDw values gradually increase as voxels approach the lesion core. Scale bar = 1mm.
(D) Scatter plot summarizes the PD-T1 distribution of WM rims across 7 EAE brain slices from 4 animals, uncovering a similar WM pathological trajectory to that shown in (C).
(E) Line plots summarize the relative abundance of IGFBP2, IGFBP3, SERPINE1, and SERPINB1 expression as a function of distance from the demyelinated (Sudan black (SB) negative) lesion core. Black arrows pointed to the intersection of SB+ and SB− areas.
(F) Relative expression profile of IGFBP and SERPIN families differentiate lesions by age. Left: Snapshots of PDw images across time in 4 representative ROI from 3 animals. Days (D) post EAE induction (T0) are labeled in magenta for each ROI, and lesion age is estimated retrospectively from the serial MRI. The appearance of each lesion is annotated by an arrowhead, and different arrowhead colors are used to track different lesions. Right: The MRI-matching ROI were further imaged through the scope of histological staining (HS) and spatial transcriptome (ST) to subdivide brain regions into ME. The relative abundance is binarized by filtering the gene expression of the IGFBP (z-score >1) and SERPIN (z-score > 0.5) family, such that spots below the cutoff are colored dark gray. Scale bar = 1 mm.
(G) Top: UMAP plots of OPC and AST colored by L2 subcluster and gene expression. Lesion edge-enriched genes, such as IGFBP3 and SERPINE1, are highly expressed by subtypes of OPC and AST, respectively. Bottom: Immunohistochemical staining of IGFBP3 (blue) and SERPINE1 (purple) in a midcoronal section of the marmoset brain with enlarged area in 50 × 50 μm2 box. High IGFBP3 and SERPINE1 labeling are in close proximity to a dilated blood vessel (open arrowhead) and are distant from a flattened blood vessel (solid arrowhead). Scale bar = 100 μm.
(H) PDw MRI and T1 map images from baseline (before EAE induction) and 4 follow-up time points after EAE induction. Normalized PDw intensities and T1 values were extracted, and the PD/T1 ratio was calculated and overlaid onto the T1 map as heatmaps. Open arrowheads indicate MRI-identifiable tissue changes, solid arrowheads indicate normal-appearing brain area. White arrowheads point to a similar brain area across time and imaging contrasts, and the black arrowhead point to a different brain area with high PD/T1 ratio.

