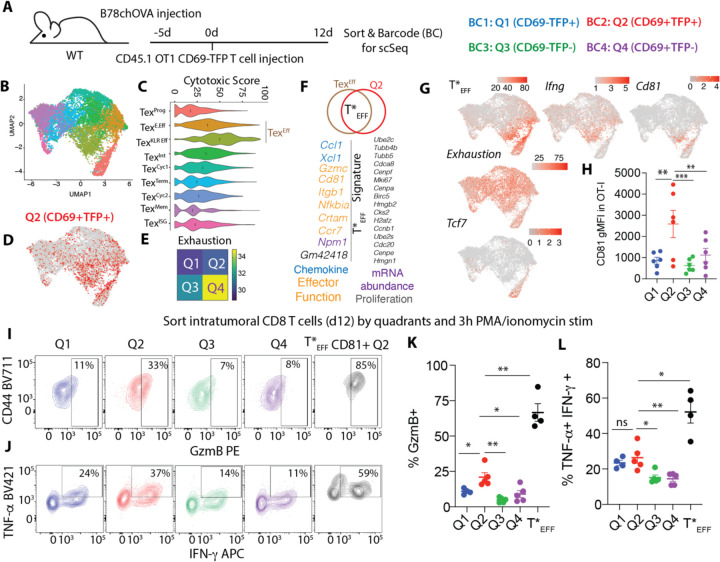
Fig. 3: Single-cell mapping of activation states reveals functionally endowed intratumoral effectors.
(A) Experimental schematic for single cell transcriptomic profiling of intratumoral OT-I T cells sorted by CD69:TFP quadrants; (B) UMAP representation of the scSeq data color-coded by computationally-derived clusters; (C) Cytotoxic scoring of the T cell subsets (black lines =median); (D) overlay of Q2 (CD69+TFP+) in the UMAP space; (E) Heatmap exhaustion score of combined TEXEff subsets by quadrants; (F) Differentially upregulated genes in in Q2 vs. Q4 within the TEXEff cells to define T*EFF signature (color-coded text indicates predicted function of similarly colored genes); (G) Overlay of T*EFF signature score, Ifng, Cd81, Exhaustion Score, and Tcf7 in the UMAP space; (H) CD81 expression in d14 intratumoral OT-I T cells grouped by quadrants; Intracellular expression of (I) GzmB, (J) TNF-α and IFN-γ in intratumoral OT-I T cells sorted by quadrants and restimulated, with a sub-gating of CD81+ cells from Q2, with (K and L) corresponding quantification. pooled data from 2 independent experiments with 2–3 biological replicates (sorted cells from 2–3 tumors each)/experiment (K, L). Plots show mean +/− SEM; null hypothesis testing by paired RM ANOVA with post-hoc paired t-tests.

