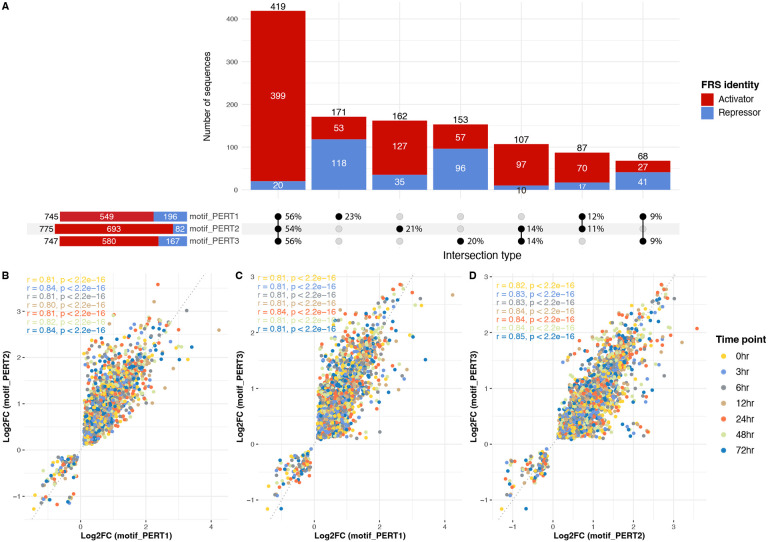
Figure 6.
Consistency of MPRA outputs among three perturbations. (A) Number of sequences that share the same FRS identities. The bars are colored by activators (red) and repressors (blue). In the “intersection type” matrix. The percentages are row-normalized, indicating the proportion of sequences belonging to different intersection types within each perturbation method. (B) The correlation of Log2FC between motif_PERT1 and motif_PERT2. Each dot is a perturbation sequence and is colored by the time point. (C) The correlation of Log2FC between motif_PERT1 and motif_PERT3. (D) The correlation of Log2FC between motif_PERT2 and motif_PERT3.

