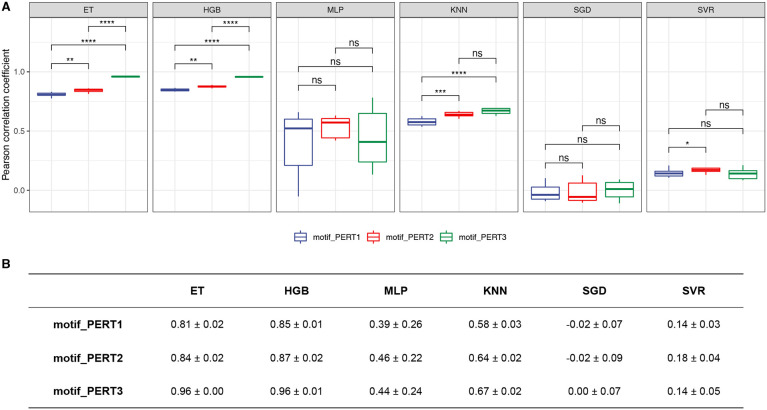
Figure 8.
Performance of regression models. (A) The Pearson correlation coefficients of different regression models. Asterisks/ns indicate levels of statistical significance, calculated by pairwise Wilcoxon rank sum tests (P-value < 0.05 *, < 0.01 **, < 0.001 ***, < 0.0001 ****; ns, non significant). (B) A summary of the mean ± standard deviation values for Pearson correlation coefficients of regression models.

