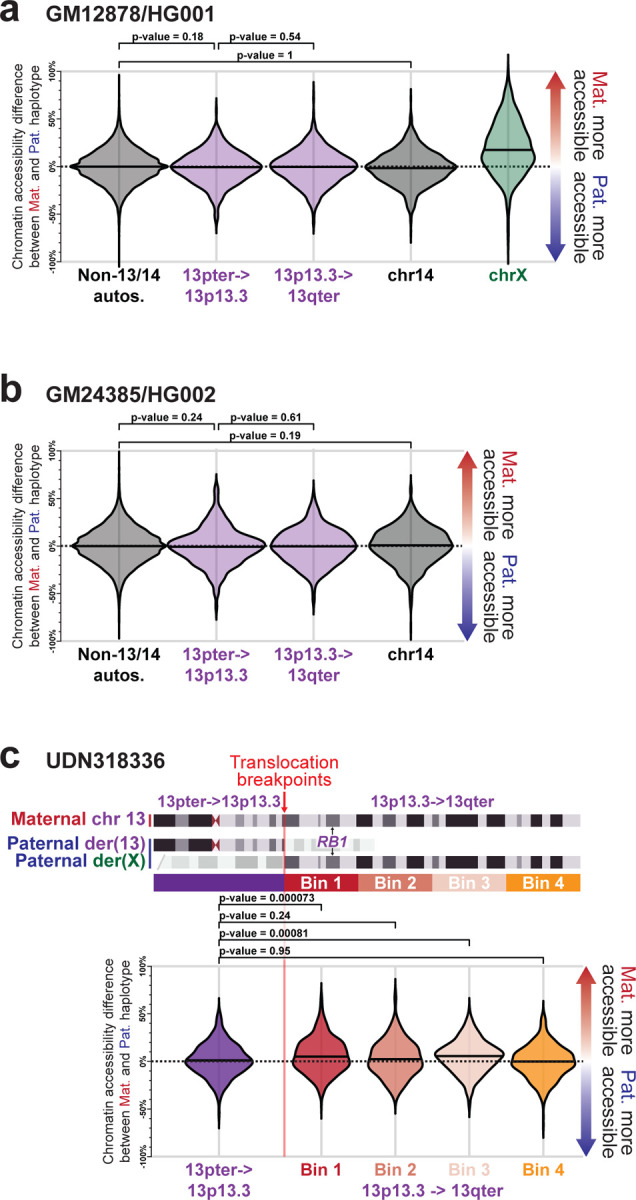
Extended Data Figure 9 |. Allelic imbalance differences along chr13.

a, Swarm plot showing the overall haplotype imbalance in chromatin accessibility along autosomes (except for chromosomes 13 and 14), chromosome X, chromosome 14, and two portions of chromosome 13 within GM12878. P-value calculated using Fisher exact test. b, Same as a, but for GM24385 cells. c, Swarm plot showing the haplotype imbalance in chromatin accessibility at different regions of chromosome 13 in fibroblasts from UDN318336.
