Figure 5:
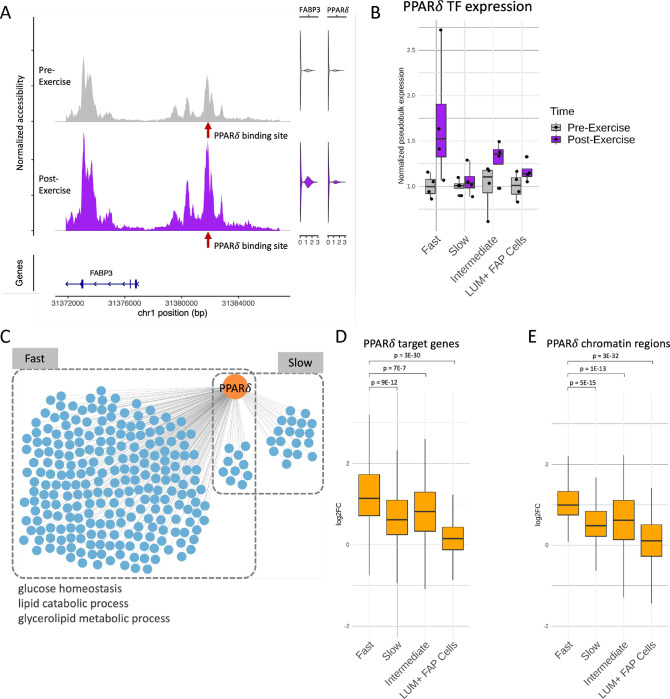
Regulatory circuitry of a fast fiber specific exercise-related TF: PPARδ. (A) Example of a regulatory circuit (PPARδ-FABP3) where TF PPARδ interacts with a cis-regulatory region upstream of the target gene FABP3 and regulates its expression after exercise. Left panel shows the normalized chromatin accessibility of the genomic regions around the transcription start site (TSS) of FABP3 in fast fibers pre-exercise (gray) and post-exercise (purple). Red arrow indicates the location of the PPARδ binding site. Right panels are violin plots showing the expression of FABP3 and PPARδ pre-exercise (gray) and post-exercise (purple). (B) Normalized pseudobulk RNA expression of PPARδ in each group, time-point and cell-type is depicted as a boxplot with one point per sample. For each group and cell-type, both the pre-exercise and post-exercise RNA exercise of each sample were normalized by the mean of the pre-exercise samples. (C) Network plot reveals the cell-type specific target genes (blue) of PPARδ (orange) identified by the integrated regulatory circuit analysis. Selected GO terms enriched in the target genes are annotated below. (D-E) Log2 fold change (log2FC) between post-exercise and pre-exercise of the target genes (D) and chromatin regions (E) in the fast fiber specific PPARδ circuitry in each cell-type. P-values are calculated using a one-sided Wilcoxon test comparing the log2FC between fast fiber and other cell-types.

