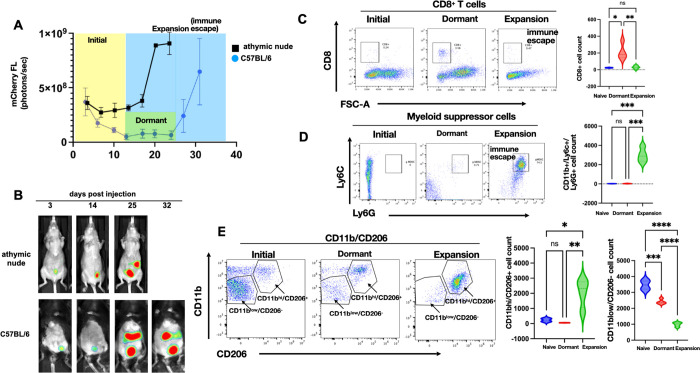
Figure 1.
Characterization of immune response during ovarian tumor progression. mCherry+ TKO mouse ovarian cancer cells were injected i.p. in C57BL/6 immunocompetent mice (n=50) or immunocompromised athymic nude mice (n=10). A. Tumor growth was quantified using mCherry ROI fluorescence. Note difference in tumor kinetics between mouse strain with the dormant phase observed only in C57BL/6 mice; B. Representative images of live animal imaging showing progression of i.p. tumor burden; C. Peritoneal lavage from TKO-bearing C57BL/6 mice from each phase of tumor progression (n=6) was stained with anti-CD8 and analyzed by flow cytometry; D. Peritoneal lavage from TKO-bearing C57BL/6 mice from each phase of tumor progression (n=6) was stained with anti-CD11b, anti-Ly6C, and anti-Ly6G and analyzed by flow cytometry; E. Peritoneal lavage from TKO-bearing C57BL/6 mice from each phase of tumor progression (n=6) was stained with anti-CD11b and CD206 and analyzed by flow cytometry. Representative dot plots are shown. Gating strategy is shown in Supp. Fig. 1. Data are presented as Mean ± SEM and One-way ANOVA was used for statistical analysis.

