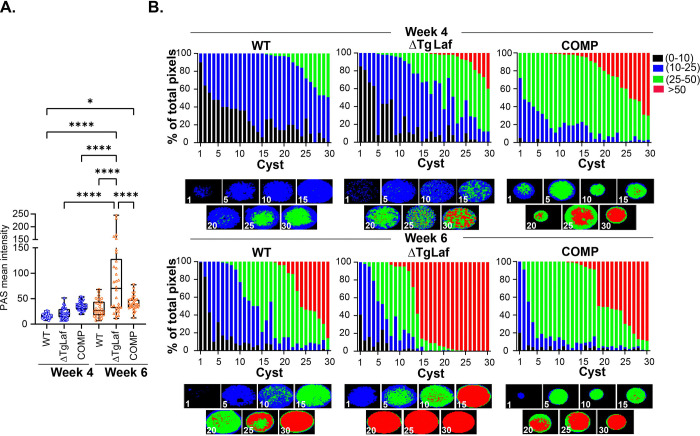
Figure 8.
Quantification of amylopectin levels in tissue cysts based on PAS intensity. A. The mean intensity of PAS labeled tissue cysts measured using Image J for WT, ΔTgLaf and COMP tissue cysts harvested at 4 and 6 weeks post infection reveal no difference in AG levels across these parasite lines at week 4. Highly significant differences are evident between WT/COMP and DTgLaf tissue cysts at week 6 post infection indicating a temporal component for the emergence of the starch excess phenotype. n=30 for each parasite line at each time point of harvest. Statistical analysis was done using Tukey’s multiple comparison test. P values: * p <0.05, **** p< 0.0001
B. Analysis of WT, DTgLaf and COMP tissue cysts harvested at weeks 4 and 6 using AmyloQuant. The 30 tissue cysts per sample presented in A. were analyzed using AmyloQuant. While acquired at random, the data are arrayed from low to high PAS intensity presented as the percentage of pixels in each classification bin. The classification bins defined as: background: Black: 0–10 grayscale, low: Blue: 10–25 grayscale, intermediate: Green 25–50 grayscale and high intensity pixels: Red >50 grayscale. The higher overall sensitivity of AmyloQuant reveals increased accumulation of AG at week 4 in the DTgLAf and COMP lines. This phenotype is greatly exaggerated at week 6 post infection consistent with a temporal component for the phenotypic manifestation of the starch excess phenotype. The pattern in the COMP parasites is intermediate between the WT and ΔTgLaf cysts. The distribution of PAS intensity levels within the imaged tissue cysts generated by AmyloQuant for cysts in 5 cyst intervals is presented under each set of stacked plots.

