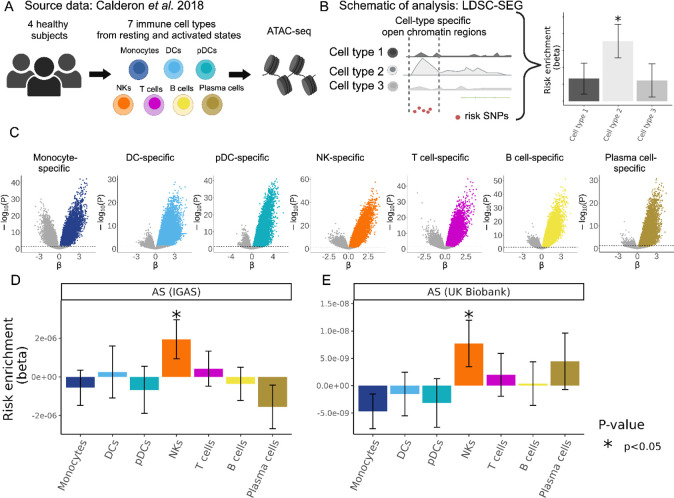
Figure 1. Human NK-specific open chromatin regions are enriched in AS genetic risk.
(A) Cartoon depicting the Calderon et al. study design. Peripheral blood cells from 4 healthy subjects were sorted into immune cell populations that we grouped in silico into seven main cell types. Assay for Transposase-Accessible Chromatin using sequencing (ATAC-seq) was performed with and without prior in vitro activation. (B) Graphical representation of LDSC-SEG: identification of cell type-specific annotations (in our case open chromatin regions), followed by the integration with GWAS summary statistics to obtain a risk enrichment coefficient and p-value. (C) Volcano plots showing results of differential accessibility analyses for each cell type compared to the other cell types. Colored dots indicate open chromatin peaks in the top decile of the t-statistic for each cell type, which were used for LDSC-SEG analysis. (D-E) Bar graphs display the AS genetic risk enrichment coefficient (y-axis) and standard error for cell type-specific open chromatin accounting for control peaks and baseline annotations. Summary statistics from the International Genetics of Ankylosing Spondylitis Consortium (IGAS) (D) and UK Biobank (E) GWAS were used. Bars marked with “*” indicate a P-value less than 0.05.

