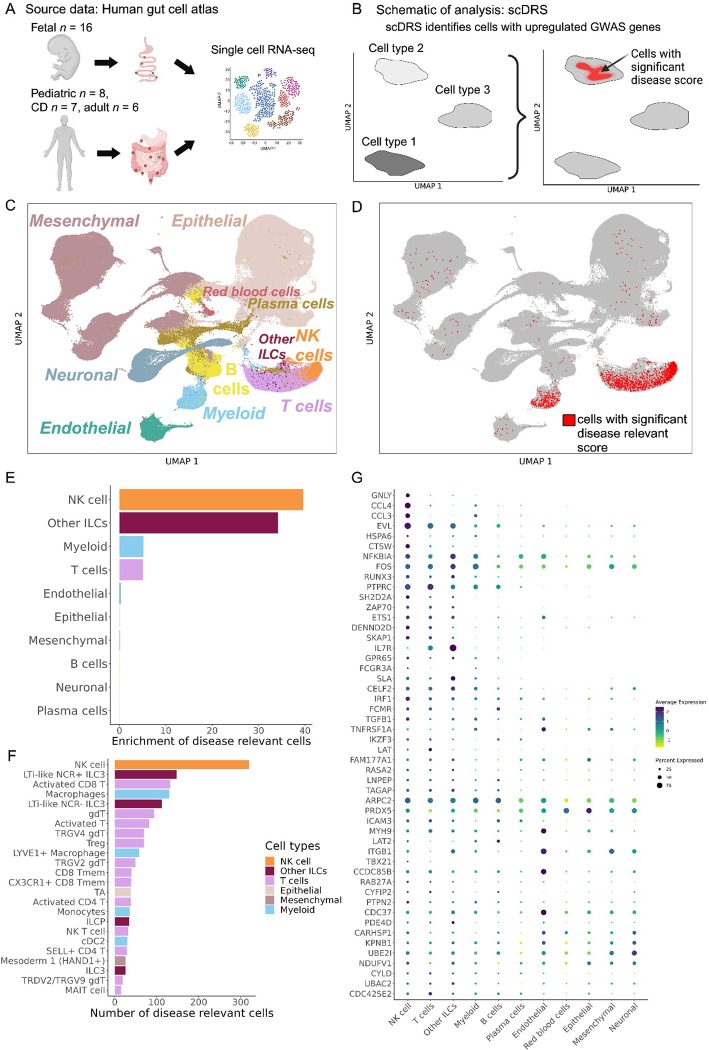
Figure 3. Human gut single-cell atlas reveals significant upregulation of AS-associated genes in NK cells.
(A) Schema depicting the generation of the Space-Time Gut Cell Atlas study with samples from fetal, pediatric and adult subjects. (B) Graphical representation of the scDRS method, which integrates GWAS risk genes with single cell data to identify disease-relevant cells. (C) Visualization of the Space-Time Gut Cell Atlas data using UMAP on the top 20 principal components from 1997 variable genes from the scRNA-seq expression matrix. (D) Same UMAP visualization as in C, where cells with significant scDRS score (20% FDR) are colored in red. (E) Bar graph showing enrichment of scDRS significant cells per cell type. (F) Bar graph showing the number of significant scDRS cells for each cell type using the fine-grained annotations from the Space-Time Gut Cell Atlas. Cell populations with at least 15 significant scDRS cells are shown. (G) Scaled average expression levels and percent of cells expressing a given gene for 50 genes associated with AS that had significant upregulation (5% FDR) in NK cells compared to the other cell types. Genes are sorted by multiplying their MAGMA score (strength of association with AS) by their average level of expression in NK cells.

