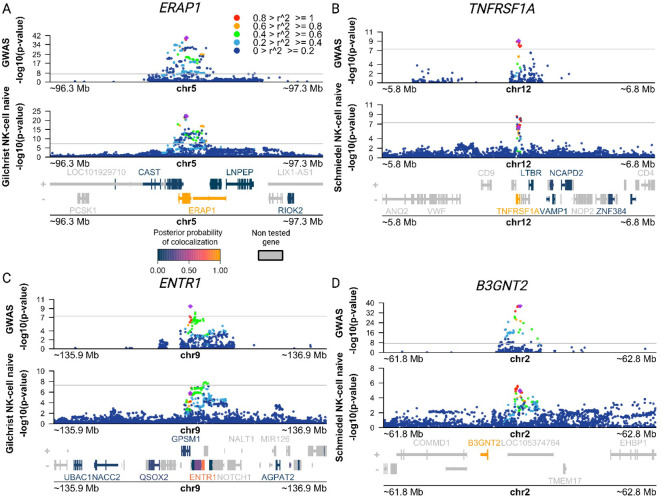
Figure. 4. Co-localization of AS risk loci and NK eQTLs points to putative target genes for AS risk variants.
(A-D) Manhattan plots showing AS GWAS and NK eQTL −log10(P-values) for SNPs within 500 kb of a lead GWAS SNP. Legend indicates the Linkage Disequilibrium (LD) between the lead GWAS SNP (purple diamond) and other SNPs in the region. Genes in the region are colored according to their posterior probability of the same causal variant being shared between two traits (PP4). (A) Manhattan plot identifying putative target gene ERAP1 using AS IGAS GWAS and NK microarray gene expression QTL (eQTL) data obtained from Gilchrist et al. (B) Manhattan plot identifying putative target gene TNFRSF1A using AS IGAS GWAS and NK gene expression QTL (eQTL) data obtained from Schmiedel et al. (C) Manhattan plot identifying putative target gene ENTR1 using AS IGAS GWAS and NK microarray gene expression QTL (eQTL) data obtained from Gilchrist et al. (D) Manhattan plot identifying putative target gene B3GNT2 using AS IGAS GWAS and NK gene expression QTL (eQTL) data obtained from Schmiedel et al. All QTL summary statistics taken from eQTL Catalogue.

