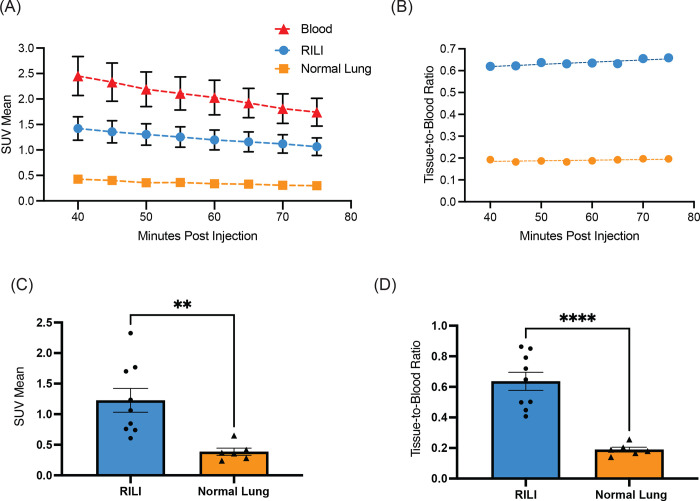
Figure 7:
Quantitative analysis of 68Ga-CBP8 PET images in human subjects with RILI. (A) 68Ga-CBP8 washout curves derived from dynamic PET images in areas of RILI, healthy lung, and blood pool. (B) Tissue-to-blood ratio for RILI and healthy lung. (C) Mean SUV is significantly elevated in RILI vs normal lung, p=0.005. (D) Tissue-to-blood ratio is significantly elevated in RILI vs normal lung, p<0.001.

