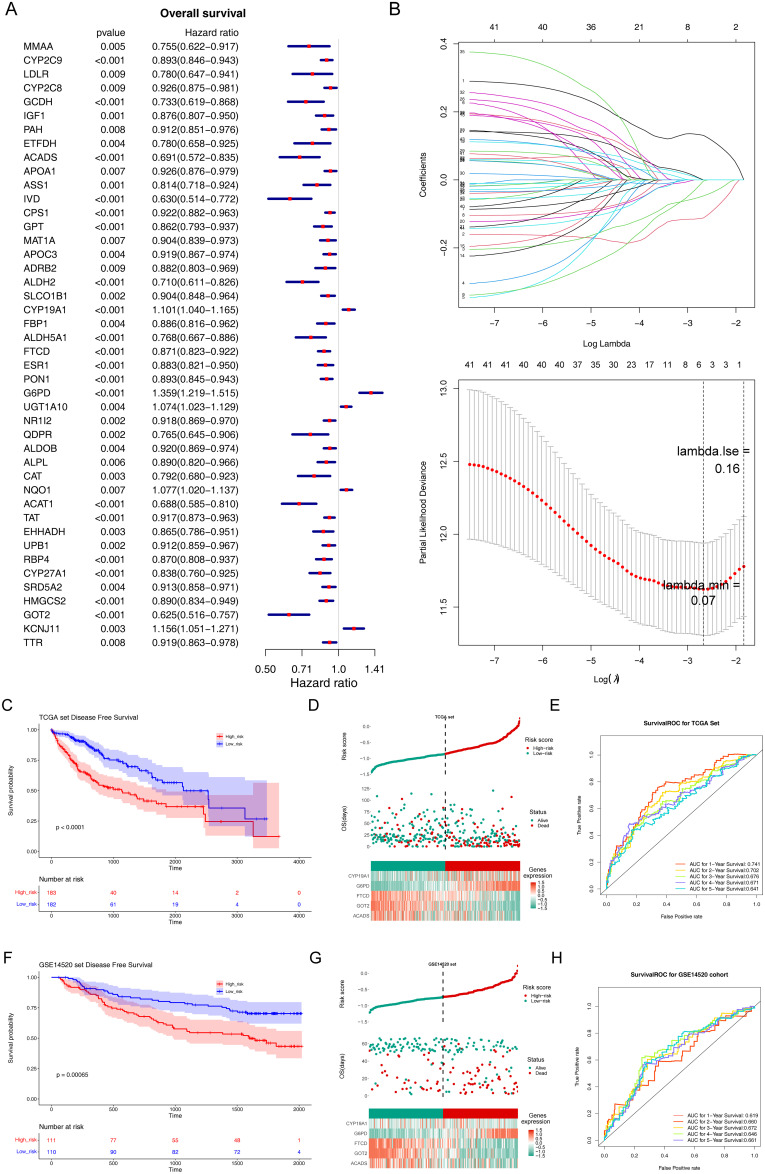
Figure 2.
Construction and validation of prognostic model for LIHC. (A) The forest diagram of 44 biomarkers obtained by univariate cox analysis (p < 0.01). (B) The coefficients of biomarkers and the error plot for cross-validation in the least absolute shrinkage and selection operator (LASSO) analysis. The different colored lines in the graphic above represent different genes. (C) Kaplan-Meier plot of patients in a low- or high-risk group (p < 0.0001), and the number of patients in different risk groups. (D) Up: The risk score of each patient with LIHC. Medium: The patient survival based on the risk score. Down: The heat map of the 5 biomarkers in the high- and low-risk group. (E) Receiver operating characteristic (ROC) curves for the predictive value of the prognostic model for different years. AUC: area under the curve. (F–H) Validation of the prognostic model in GSE14520 dataset. (F) Kaplan-Meier plot of patients in a low- or high-risk group (p = 0.00065), and the number of patients in different risk groups. (G) Up: The risk score of each patient with LIHC. Medium: The patient survival based on the risk score. Down: The heat map of the 5 biomarkers in the high- and low-risk group. (H) ROC curves for the predictive value of the prognostic model for different years.

