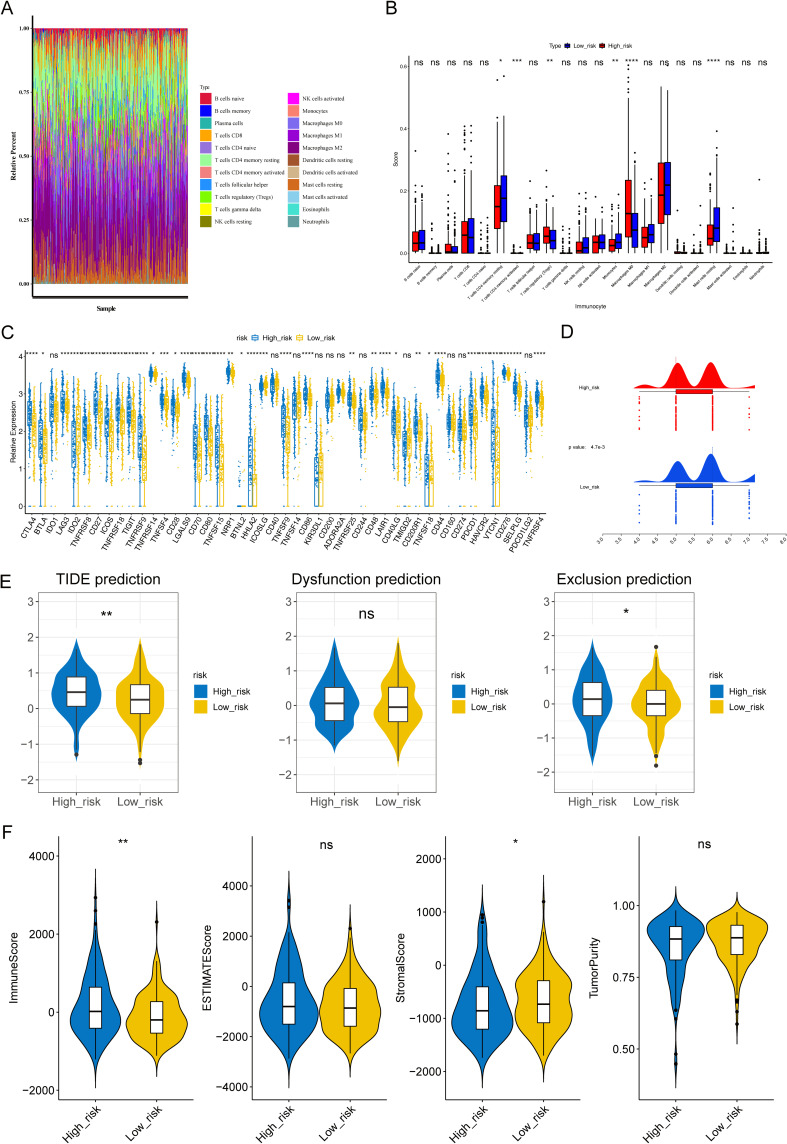
Figure 5.
Analysis of immune infiltration and immunotherapy between high- and low-risk groups. (A) The proportion of 22 immune cells in LIHC samples. (B) Discrepancies of immune cells between high- and low-risk groups. ns, not significant; *p<0.05; ** p<0.01; ***p<0.001; ****p<0.0001. (C) Comparison of 47 immune checkpoints expression between high- and low-risk groups. ns, not significant; *p<0.05; ** p<0.01; ***p<0.001; ****p<0.0001. (D and E) The discrepancies of immunophenscore (IPS) (D) and tumor immune dysfunction and exclusion (TIDE) score (E) between high- and low-risk groups. ns, not significant; *p<0.05; ** p<0.01. (F) Comparison of immune score, ESTIMATE score, stromal score, and tumor purity between high- and low-risk groups. *p < 0.05, **p < 0.01.
Abbreviation: ns, not significant.

