
Figure 1.
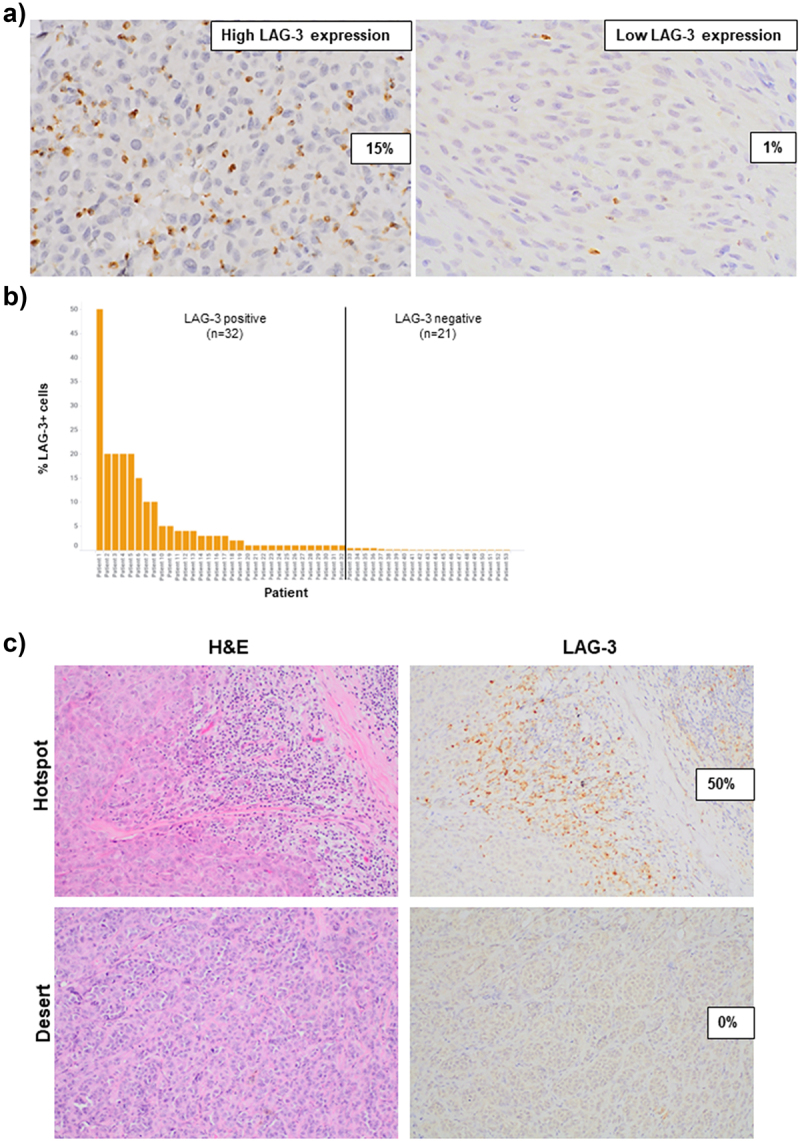
LAG-3 expression in pre-treatment melanoma specimens.
a) Representative images demonstrating high and low LAG-3 staining in a pre-treatment metastatic melanoma specimen. b) Bar graph illustrating the proportion of patients with LAG-3-positive tumors (LAG-3 ≥ 1%). c) Representative images showing hotspot regions with high LAG-3 staining and desert regions with no LAG-3 staining, which correlated with the amount of immune cells present. All images were taken at 40× magnification.