
Figure 2.
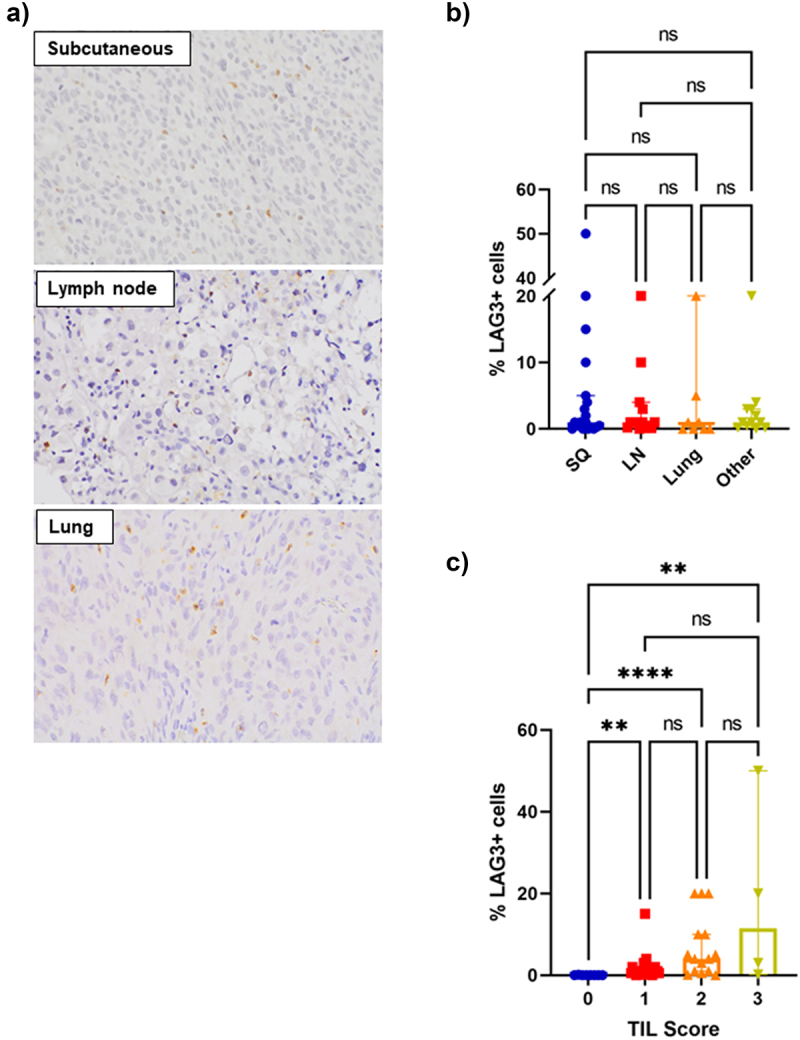
Association between LAG-3 expression, sites of disease and TILs.
a) Representative images (40× magnification) showing LAG-3 staining in subcutaneous, lymph node and lung metastases. b) Bar graph revealing no significant differences in LAG-3 expression between sites of metastases. c) Bar graph showing significant associations between LAG-3 expression and TIL grade. Error bars represent median ±95% CI. **P < .01, ****P < .0001, ns – non-significant, as determined by a Kruskal–Wallis test.