
Figure 3.
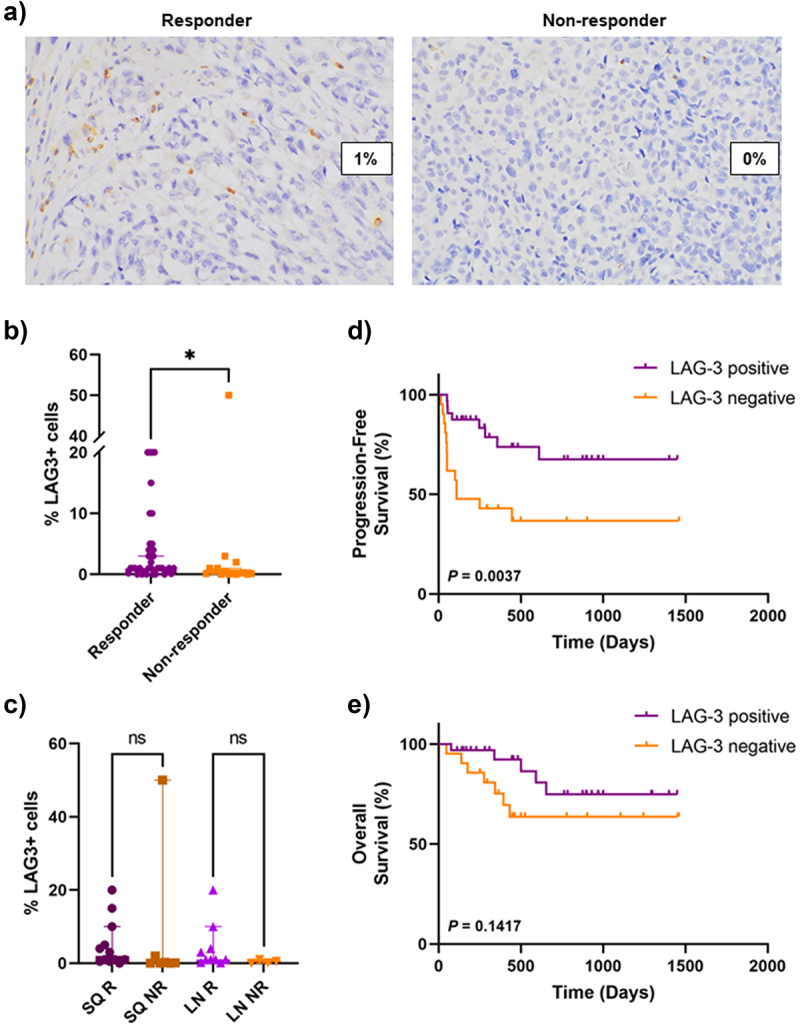
Association between LAG-3 expression and clinical outcomes.
a) Representative images (40× magnification) illustrating LAG-3 expression in responders and non-responders. b) Bar graph showing significantly higher percentage of LAG-3+ cells in responders compared to non-responders. c) Bar graph demonstrating no significant differences in the percentage of LAG-3+ cells between responders and non-responders based on site of disease. Kaplan–meier curves comparing d) progression-free survival and e) overall survival between patients with LAG-3-positive and LAG-3-negative tumors using the log-rank (Mantel-Cox) test. Error bars represent median ±95% CI. *P < .05, ns – non-significant, as determined by a Mann–Whitney U test. SQ – subcutaneous, LN – lymph node, R – responder, NR – non-responder.