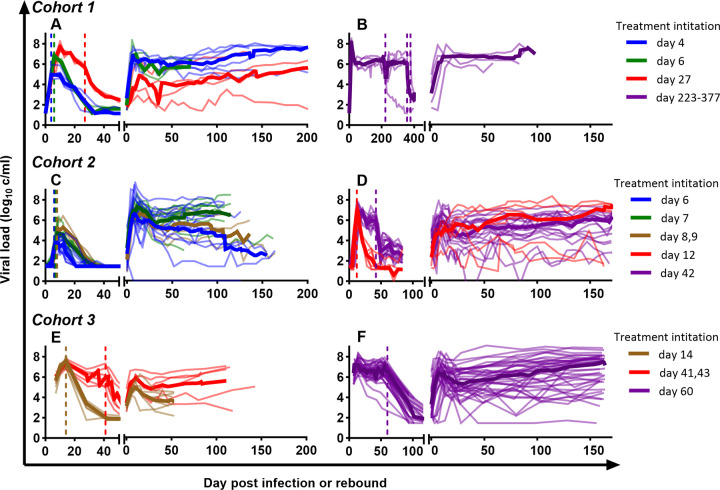
Fig 1. Dynamics of viral load by cohorts.
Thick coloured lines are the group median viral loads, thin lines of the matched colour are the individual viral loads of monkeys from the same group. Vertical dashed lines indicate the timing of antiretroviral treatment initiation of monkeys in the group with respectively coloured lines.

