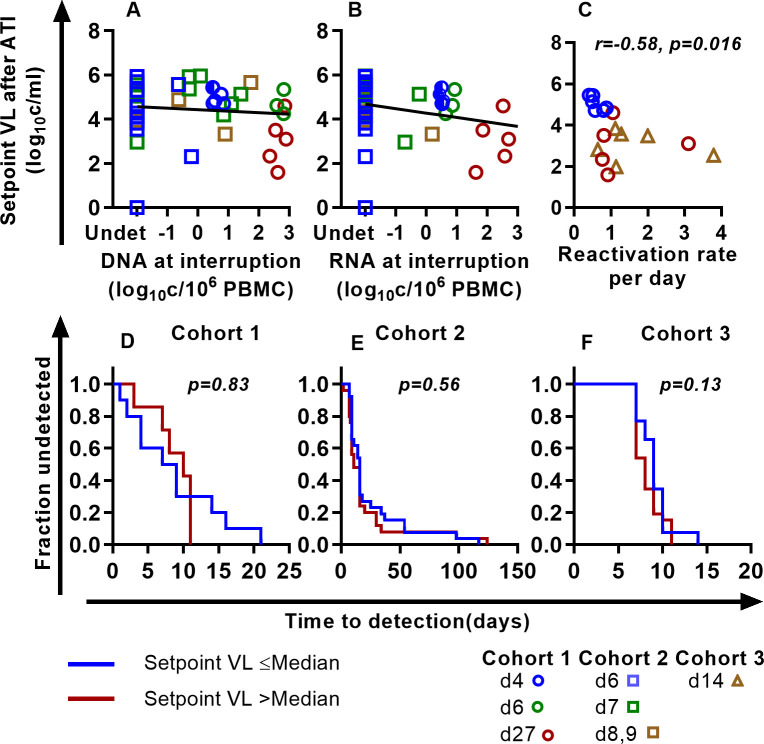
Fig 5.
Reservoir size, reactivation frequency, and early post-rebound viral setpoint: (A, B) Weak or no association of SIV DNA (A) and SIV RNA (B) with the set point viral load at rebound. Linear mixed effect modeling (considering each cohort as a random effect for the slope and intercept of the line) finds no relationship between SIV DNA and RNA with the setpoint viral load we used. Fixed effect slopes are -0.066 and -0.202, p-values for slopes are 0.56 and 0.117 for SIV DNA and SIV RNA respectively (see Table E in S1 Text for the best-fit parameters). The frequency of rebound was directly measured in a subset of animals infected with a barcoded virus (C). Higher frequency of rebound was significantly associated with lower post-rebound setpoint viral load (r = -0.58, p = 0.016). D, E, F To investigate the relationship between time-to-rebound and post-rebound setpoint viral loads, we divided the groups into two, separating those higher or lower than the median post-rebound setpoint viral levels. Time to detection of virus after treatment interruption in monkeys with setpoint viral load less than or equal to median setpoint viral load (blue line) and greater than median (red line) is not different in any of the groups (log-rank test).

