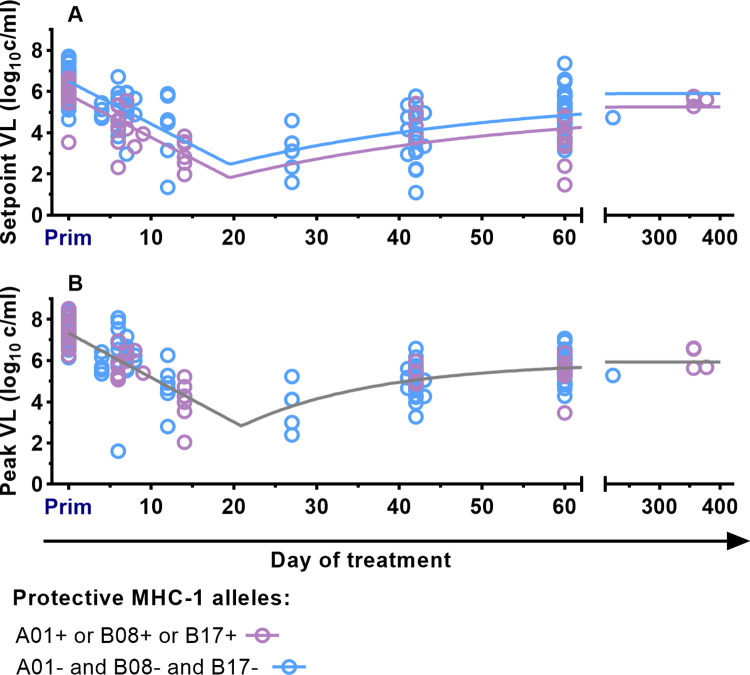
Fig 8. Impact of protective MHC Mamu-A*01, B*08, and B*17 on the setpoint and peak viral load.
A. Fitting the model defined by Formula (2) to data from macaques with any protective MHC-1 alleles A*01, B*08, B*17 (purple points and curves) and macaques without these known protective alleles (blues points and curves). The curves are allowed to differ by only one parameter (the viral load at day 0 post infection–b0), with the rest of the parameters fitted simultaneously to both datasets. For the data on post-rebound setpoint viral levels, the model allowing different viral levels for animals with protective alleles fits better than the model with all parameters the same. The setpoint viral load is lower in macaques with protective alleles by 0.65 log10 copies/ml (F-test’s p-value = 0.0002, best-fit parameters are in Table F in S1 Text. The best-fit parameters for the model with single b0 are in Table B in S1 Text). B. For data on post-rebound peak viral levels, the best fit model is one in which there is no difference between groups with and without protective alleles (indicated as grey curve) (F-test p-value = 0.61. Best-fit parameters of the model with different b0 are presented in Table F in S1 Text. Best-fit parameters for the model with a single b0 are in Table B in S1 Text). This suggests that the post-rebound peak viral load is not affected by the presence of protective MHC-1 Mamu-A*01, B*08, and B*17 alleles.

