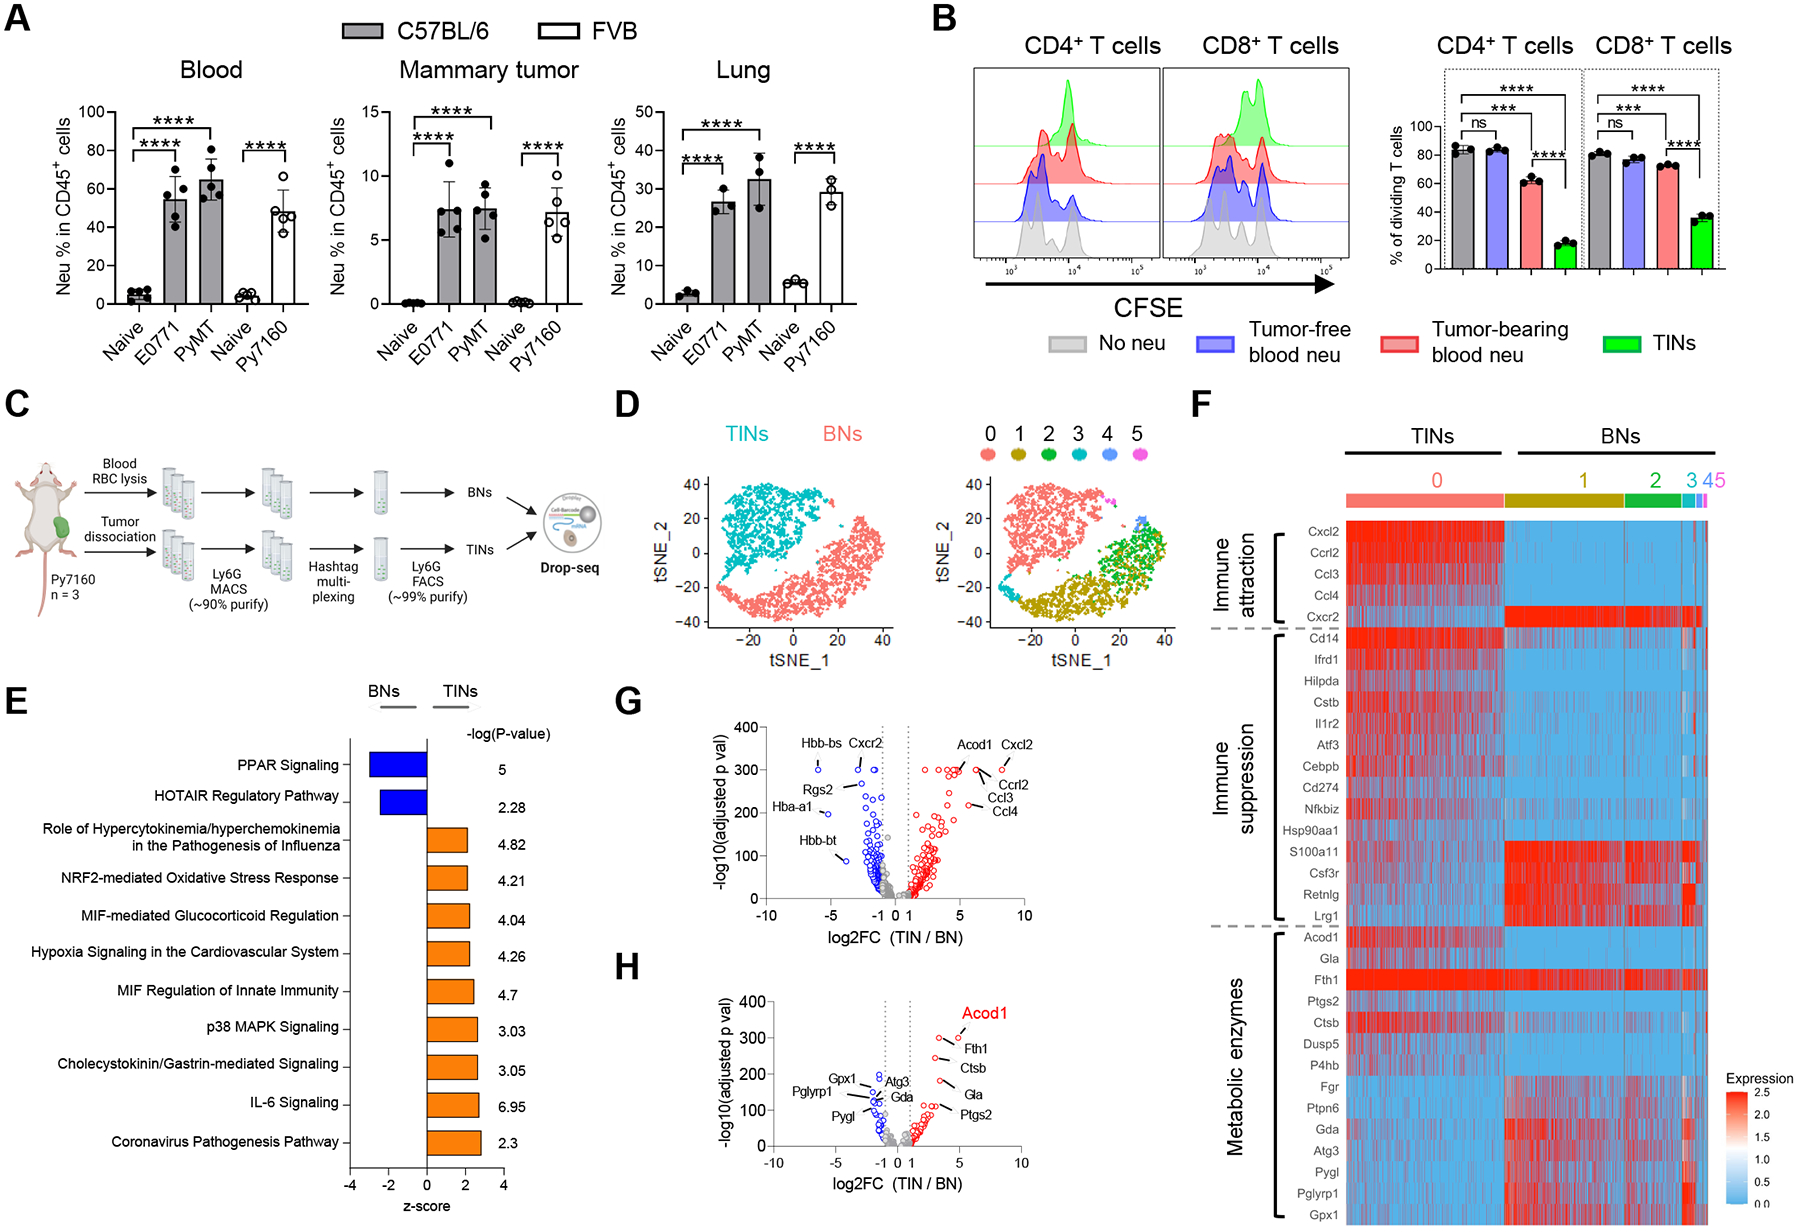
Figure 1. Neutrophils in the mammary TME demonstrate potent immunosuppression and distinct transcriptomic features.

(A) Flow cytometry analysis of neutrophil populations (CD11b+Ly6G+) in blood (n=5), mammary tumors (n=5) and lung metastases (n=3) of mouse BC models. (B) CFSE dilution histograms and proliferating proportions of αCD3/αCD28-stimulated spleen T cell subsets cocultured with neutrophils (1:1 ratio) isolated from tumor-free or E0771 tumor-bearing mice (n=3). (C) Schematic for sample processing, neutrophil sorting and Drop-seq of BNs and TINs from Py7160-bearing mice (n=3). (D) t-distributed stochastic neighbor embedding (t-SNE) plots colored by tissue of origin (left) or cell clusters (right). (E) Top-ranked IPA pathways upregulated in TINs or BNs. (F) Heatmap of most differentially expressed genes by TINs and BNs associated with immune attraction, immune suppression, and metabolic enzymes. (G) Volcano plot of differentially expressed genes (adjusted p values < 0.05). (H) Volcano plot of differentially expressed genes encoding metabolic enzymes (adjusted p values < 0.05). For A and B, data represent mean ± s.e.m.; ns, not significant, ***P<0.001, ****P<0.0001, unpaired two-tailed Student’s t-test. See also Figure S1 and Table S1–S3.
