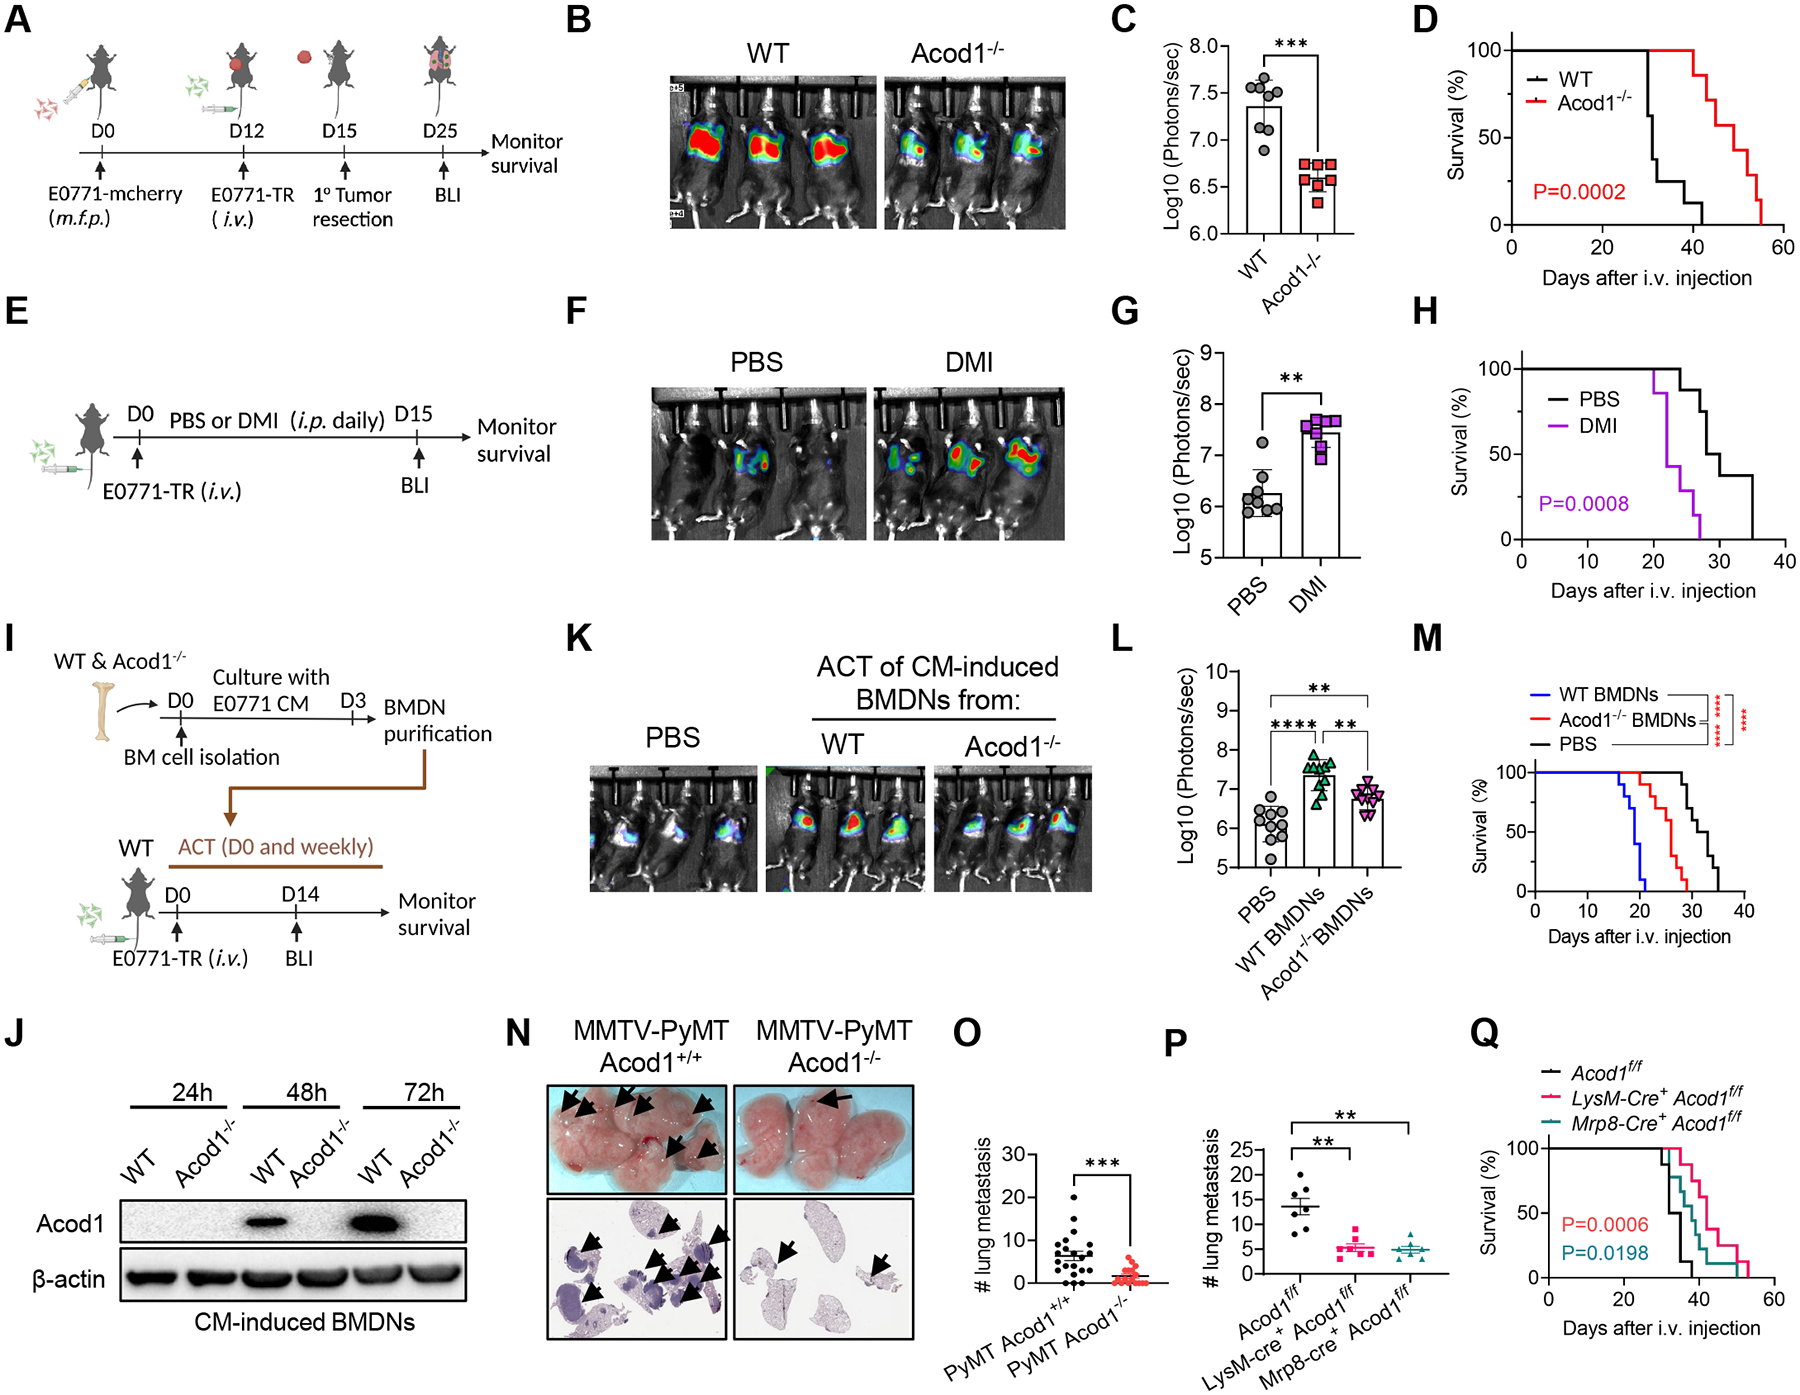
Figure 3. Neutrophil Acod1 promotes lung metastasis in mouse BC models.

(A) Experimental lung metastasis assay scheme based on E0771. (B-C) Representative BLI images (n=3) and quantification (WT n=8, Acod1‒/‒ n=7) at day 15 after i.v. injection of E0771-TR. (D) Survival curves (WT n=8, Acod1‒/‒ n=7). (E) Assessing the effect of PBS or DMI (100mg kg‒1, daily i.p.) on E0771-TR lung metastasis grown in WT mice. (F-G) Representative BLI images (n=3) and quantification (PBS n= 8, DMI n=7) at day 15 after i.v. injection of E0771-TR. (H) Survival curves (PBS n= 8, DMI n=7). (I) Schematic of ACT of WT or Acod1‒/‒ BMDNs cultured with E0771 CM into WT cohorts i.v. injected of E0771-TR. (J) Western blot of Acod1 for WT or Acod1‒/‒ BMDNs cultured with E0771 CM for 24h, 48h or 72h. (K-L) Representative BLI images and quantification (n=10) at day 14 after i.v. injection of E0771-TR. (M) Survival curves (n=10). (N) Representative photographs and HE staining of lungs in MMTV-PyMT Acod1+/+ and MMTV-PyMT Acod1‒/‒ cohorts when mice died from primary tumors. Arrows denote metastases. (O) Quantification of lung metastasis nodules (MMTV-PyMT Acod1+/+ n=21, MMTV-PyMT Acod1‒/‒ n=17). (P) Quantification of lung metastasis nodules in cohorts Acod1 f/f, LysM-Cre+ Acod1f/f and Mrp8-Cre+ Acod1f/f, 2 weeks after i.v. injection of E0771 (n=7/group). (Q) Survival of Acod1 f/f (n=8), LysM-Cre+ Acod1f/f (n=9) and Mrp8-Cre+ Acod1f/f (n=9) mice after i.v. injection of E0771. For C, G, O and P, data represent mean ± s.e.m.; **P<0.01, ***P<0.001, Mann-Whitney test. For L, data represent mean ± s.e.m.; **P<0.01, ****P<0.0001, one-way ANOVA with Tukey’s multiple comparisons test. For D, H, M and Q, log-rank test with P values labeled or ****P<0.0001. See also Figure S3.
