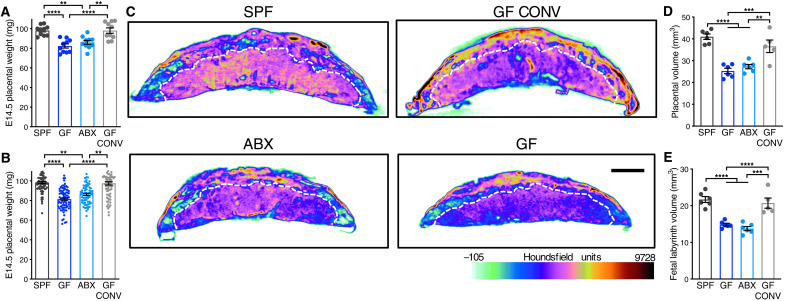
Fig. 1. The maternal microbiome promotes placental development.
(A) E14.5 placental weights by litter average [SPF (n = 10), GF (n = 10), ABX (n = 10), and GF CONV (n = 10)]. (B) E14.5 placental weights for each individual from litters shown in Fig. 1A [SPF (n = 80), GF (n = 81), ABX (n = 65), and GF CONV (n = 77)]. (C) Representative cross sections of E14.5 whole-placental μCT reconstructions from SPF, GF, ABX, and GF CONV litters. White hashed line distinguishes fetal placental labyrinth compartment; scale bar, 1 mm; Houndsfield scale ranges from −105 (light green) to 9728 (maroon). (D) Quantification of E14.5 whole-placental volumes from μCT reconstructions by litter average [SPF (n = 6), GF (n = 6), ABX (n = 6), and GF CONV (n = 5)]. (E) Quantification of fetal placental labyrinth volumes from μCT reconstructions shown in (D). Data represent mean ± SEM; statistics were performed with one-way ANOVA with Tukey post hoc test (litter averages) or with one-way nested with Sidak multiple comparisons correction (individual conceptuses). **P < 0.01, ***P < 0.001, and ****P < 0.0001.

