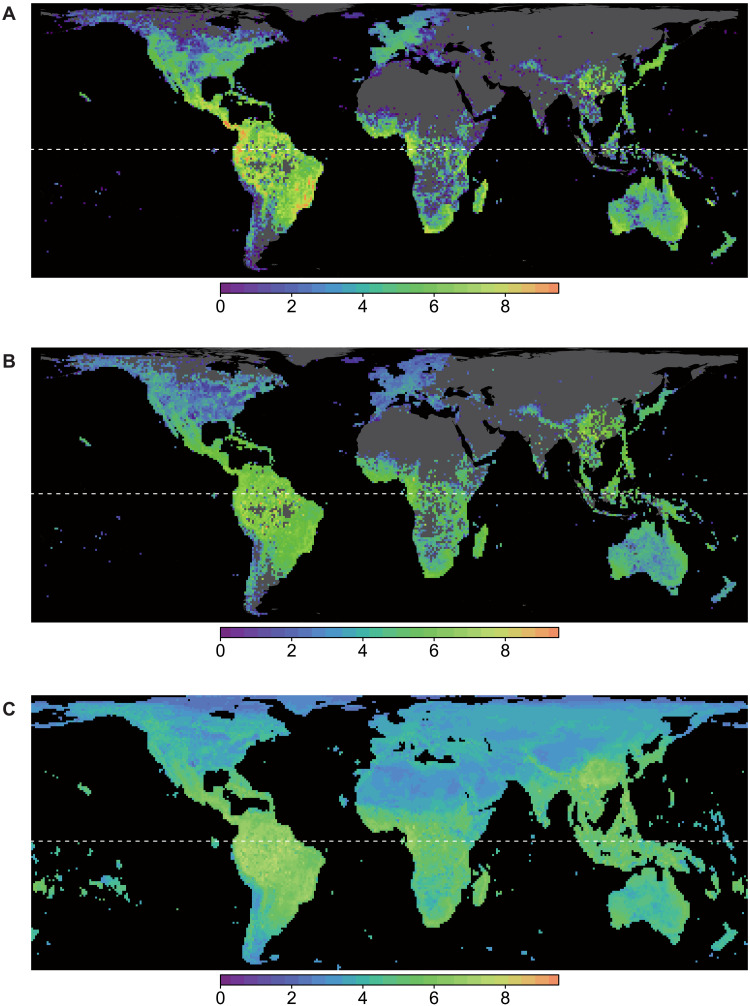
Fig. 2. Geographical distribution of species richness (Hill number q = 0) for 100 km–by–100 km grid cells.
(A) Observed species richness, (B) sample coverage–based standardized species richness (sample coverage = 0.82), and (C) spatial projection of random forest model for standardized richness. The values are log-scaled. Patterns for diversity at higher orders (q = 1 and 2) are given in fig. S18.

