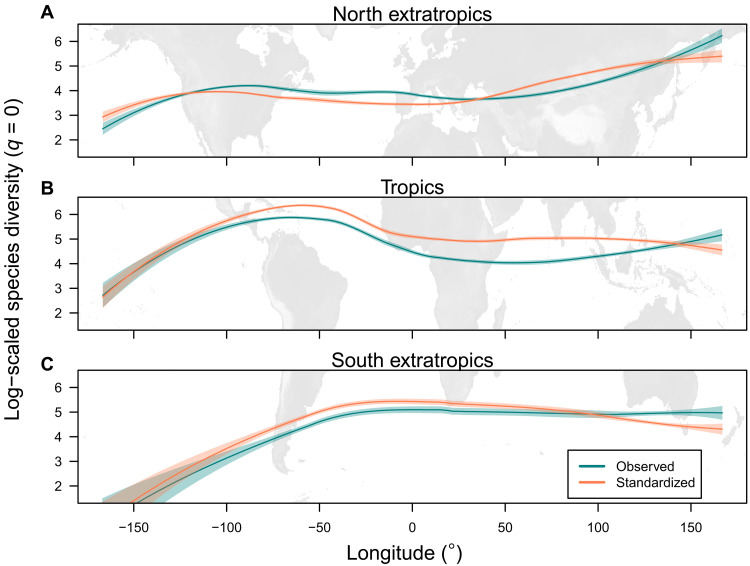
Fig. 4. Longitudinal pattern of species richness in three latitudinal zones for the 100 km–by–100 km grid cells.
The globe was subdivided into (A) northern extratropics, (B) tropics, and (C) southern extratropics: the observed species richness and the standardized species richness (species diversity at the order q = 0) based on sample coverage (0.82). The diversity values are log-scaled. Loess curve (scaling parameter α = 0.6) with 95% confidence interval is shown (green and red lines). Patterns for diversity at higher orders (q = 1 and 2) are given in fig. S20.

