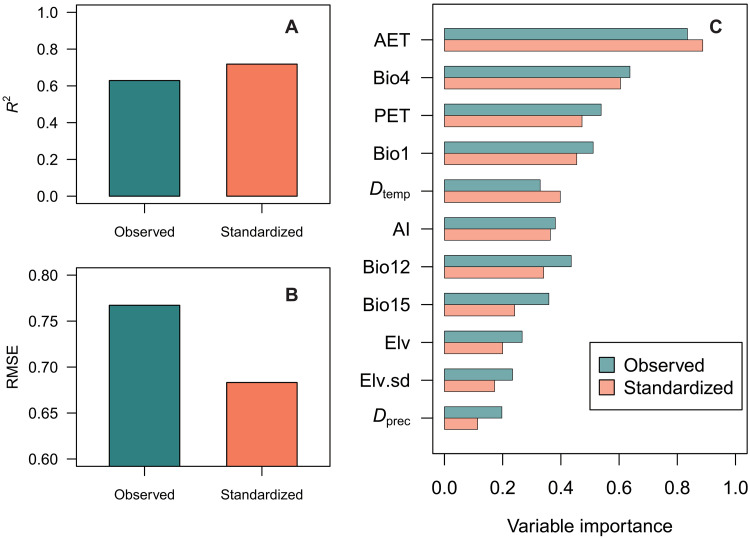
Fig. 5. Outputs of the random forest model explaining the observed and the sample coverage–based standardized species richness (sample coverage = 0.82) evaluated at the 100 km–by–100 km grid cell level.
(A) Explanatory power (R2), (B) root mean square error (RMSE) of prediction, and (C) the relative importance of environmental variables. The environmental explanatory variables are mean annual temperature (Bio1), temperature seasonality (Bio4), annual precipitation (Bio12), precipitation seasonality (Bio15), actual evapotranspiration (AET), potential evapotranspiration (PET), aridity index (AI), average elevation (Elv), SD of elevation (Elv.sd), and differences in temperature (Dtemp) and precipitation (Dprec) between the Last Glacial Maximum (LGM) and the present. Results for diversity at higher orders (q = 1 and 2) are given in figs. S21 and S22.

